Market Report! Here’s a quick Real Estate market report of most of Cape May County. Included is a recap of all sold properties(SFH, Land, Condo, etc) in the month of June 2021 for a given area; as well as a current look at the current inventory of residential single family homes(SFH) in an area as of July 4th 2021.
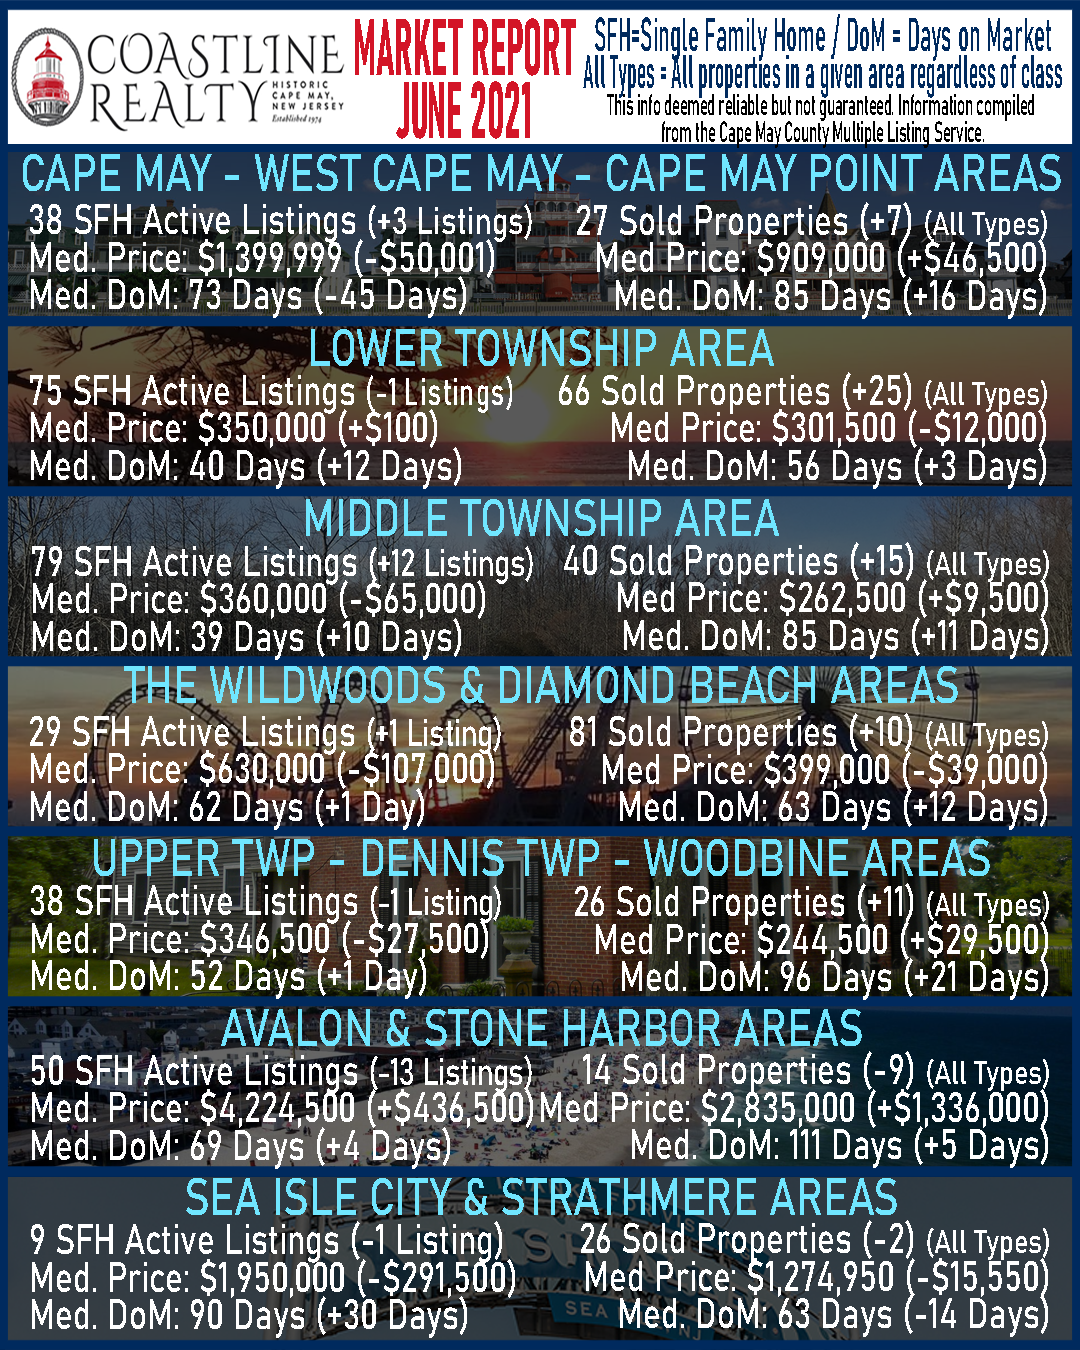
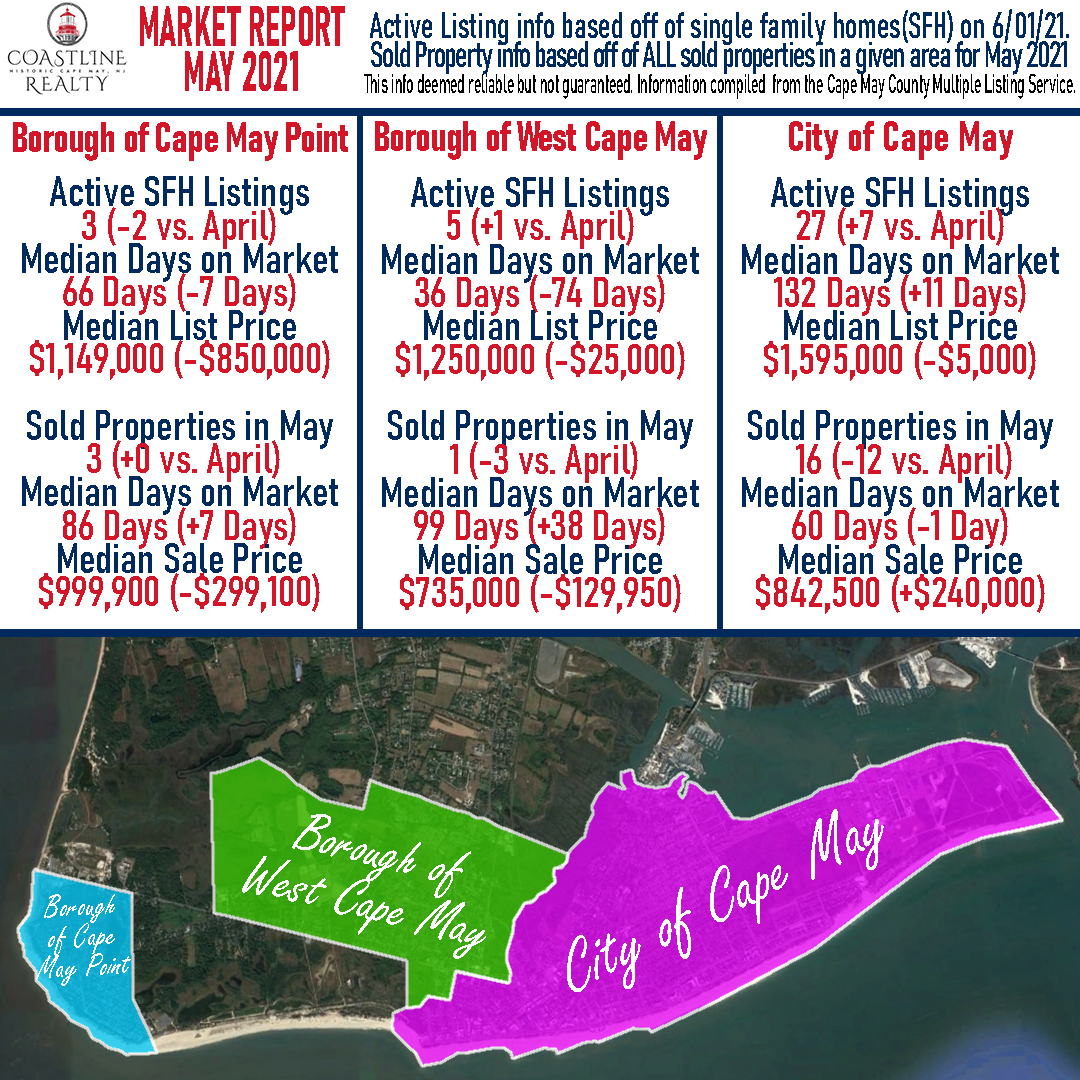
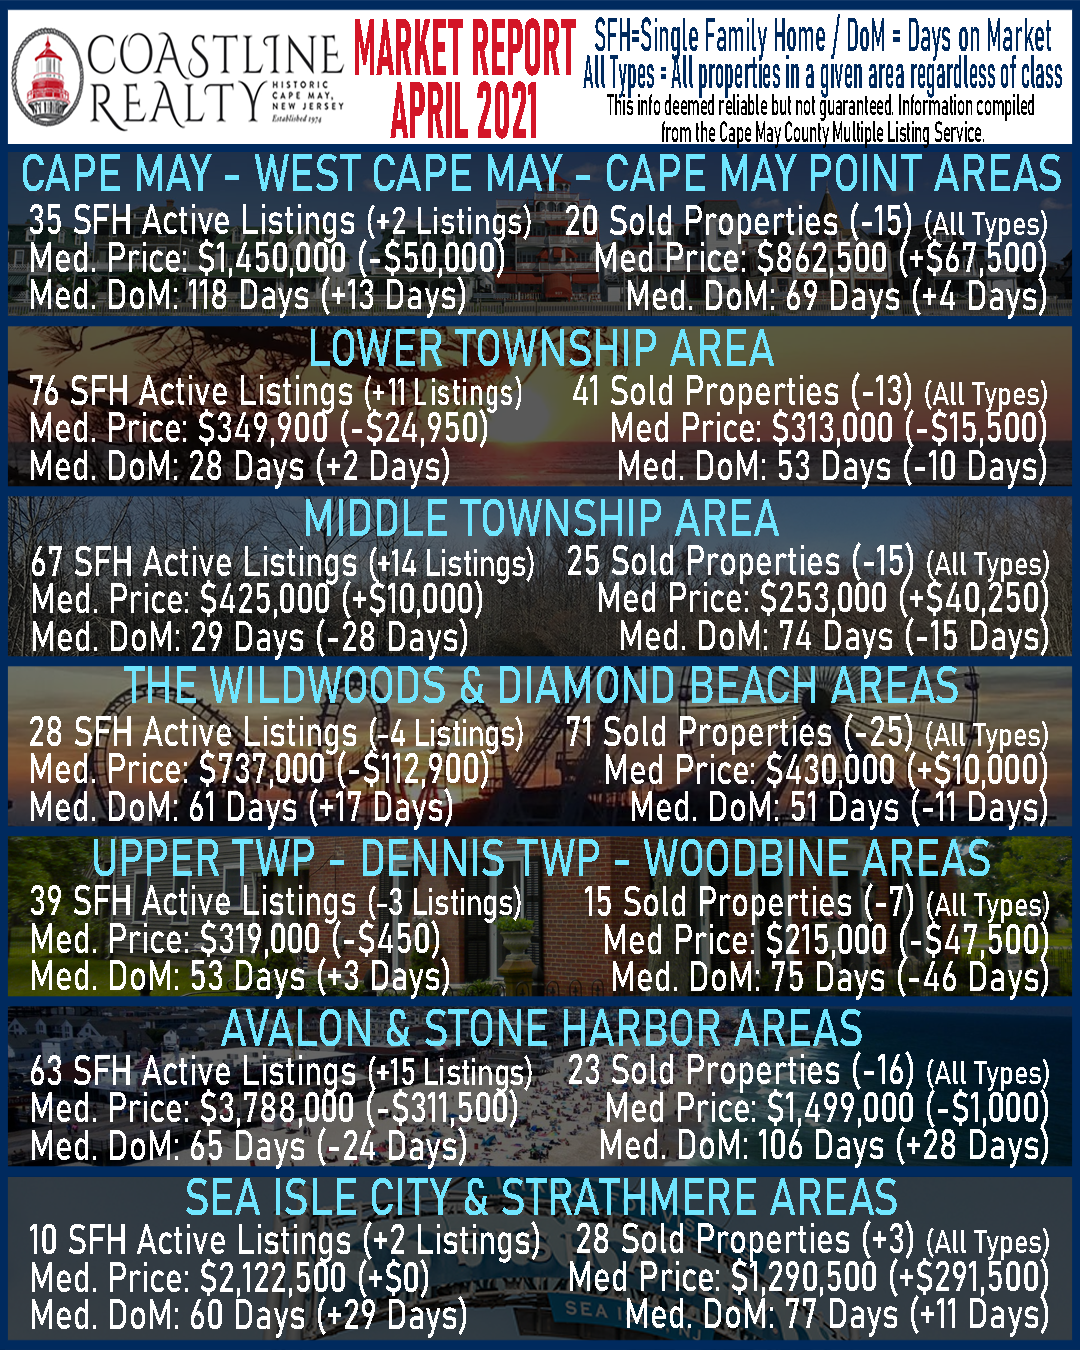
Cape May Area (including Cape May City – West Cape May – Cape May Point)
Active SFH Listings as of 07/05/21– 38 (+3 vs. last month)
Median Days on Market – 73 Days (-45 Days vs. last month)
Median List Price – $1,399,999 (-$50,001 vs. last month)
Sold Properties in June – 27 (+7 vs. last month)
Median Days on Market – 85 Days (+16 days vs. last month)
Median Sale Price – $909,000 (+$46,500 vs. last month)
Lower Township
Active SFH Listings as of 07/04/21– 75 (-1 vs. last month)
Median Days on Market – 40 Days (+12 days vs. last month)
Median List Price – $345,000 (+$100 vs. last month)
Sold Properties in June – 66 (+25 vs. last month)
Median Days on Market – 56 Days (+3 days vs. last month)
Median Sale Price – $301,500 (-$12,000 vs. last month)
Middle Township
Active SFH Listings as of 07/04/21– 79 (+12 vs. last month)
Median Days on Market – 39 Days (+10 days vs. last month)
Median List Price – $360,000 (-$65,000 vs last month)
Sold Properties in June – 40 (+15 vs. last month)
Median Days on Market – 85 Days (+11 days vs. last month)
Median Sale Price – $262,500 (+$9,500 vs. last month)
The Wildwoods & Diamond Beach
Active SFH Listings as of 07/04/21– 29 (+1 vs. last month)
Median Days on Market – 62 Days (+1 Day vs. last month)
Median List Price – $630,000 (-$107,000 vs. last month)
Sold Properties in June – 81 (+10 vs. last month)
Median Days on Market – 63 Days (+12 days vs. last month)
Median Sale Price – $399,000 (-$39,000 vs. last month)
Dennis Township – Upper Township – Woodbine
Active SFH Listings as of 07/04/21– 38 (-1 vs. last month)
Median Days on Market – 52 Days (+1 day vs. last month)
Median List Price – $346,500 (+$27,500 vs. last month)
Sold Properties in June – 26 (+11 vs. last month)
Median Days on Market – 96 Days (+21 Days vs. last month)
Median Sale Price – $244,500 (+$29,500 vs. last month)
Avalon & Stone Harbor
Active SFH Listings as of 07/04/21– 50 (-13 vs. last month)
Median Days on Market – 69 Days (+4 days vs. last month)
Median List Price – $4,224,500 (+$436,500 vs. last month)
Sold Properties in June – 14 (-9 vs. last month)
Median Days on Market – 111 Days (+5 days vs. last month)
Median Sale Price – $2,835,000 (+$1,336,000 vs. last month)
Sea Isle City & Strathmere
Active SFH Listings as of 07/04/21– 9 (-1 vs. last month)
Median Days on Market – 90 Days (+30 days vs. last month)
Median List Price – $1,950,000 (-$172,500 vs. last month)
Sold Properties in June – 26 (-2 vs. last month)
Median Days on Market – 63 Days (-14 days vs. last month)
Median Sale Price – $1,274,950 (-$15,550 vs. last month)
Are you looking to sell your property. Or are you curious about what it’s market value is? Give us a call at 609-884-5005 or inquire on our website. https://www.coastlinerealty.com/real-estate/selling-your-property
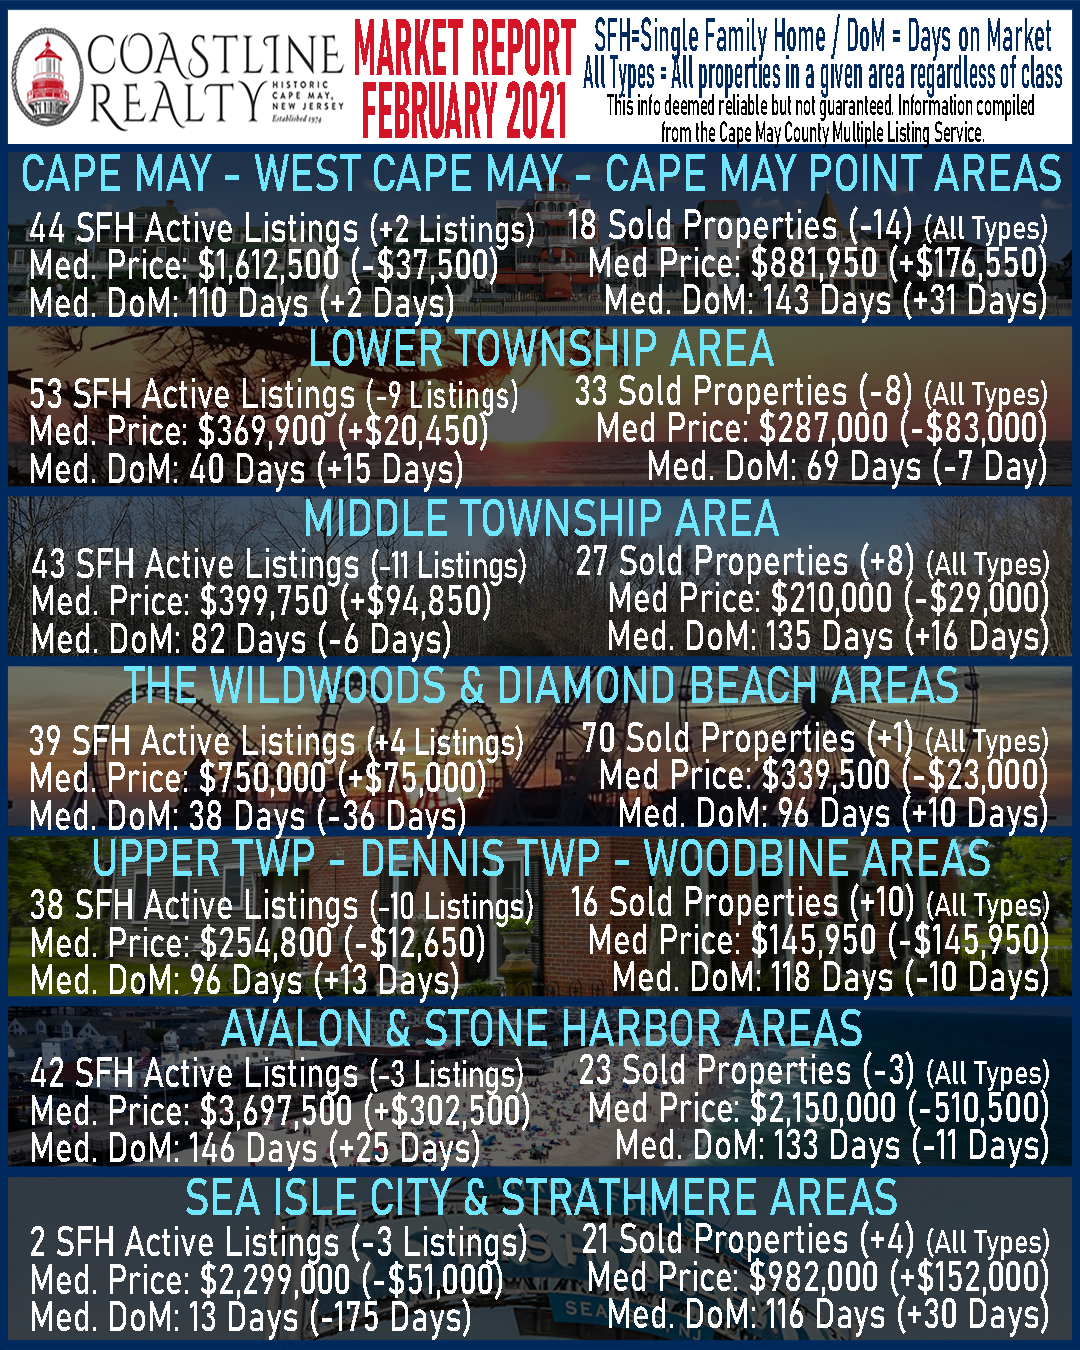
This info deemed reliable but not guaranteed. Information compiled from the Cape May County Multiple Listing Service.