Market Report! Here’s a quick Real Estate market report of most of Cape May County. Included is a recap of all sold properties(SFH, Land, Condo, etc) in the month of March 2022 for a given area; as well as a current look at the current inventory of residential single family homes(SFH) in an area as of April 2nd, 2022

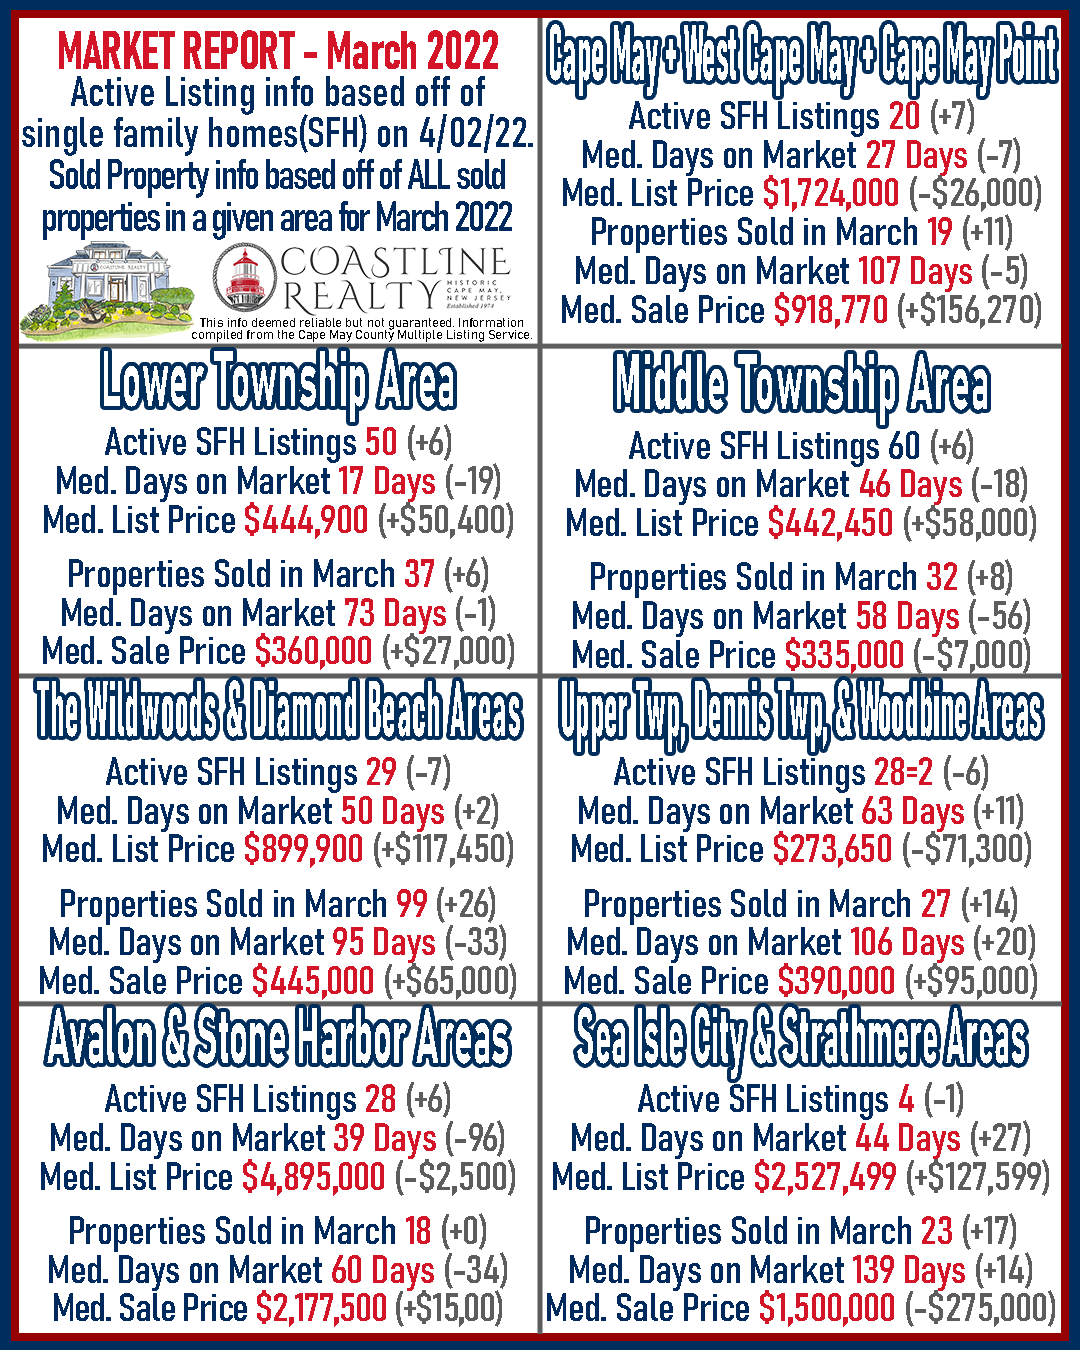
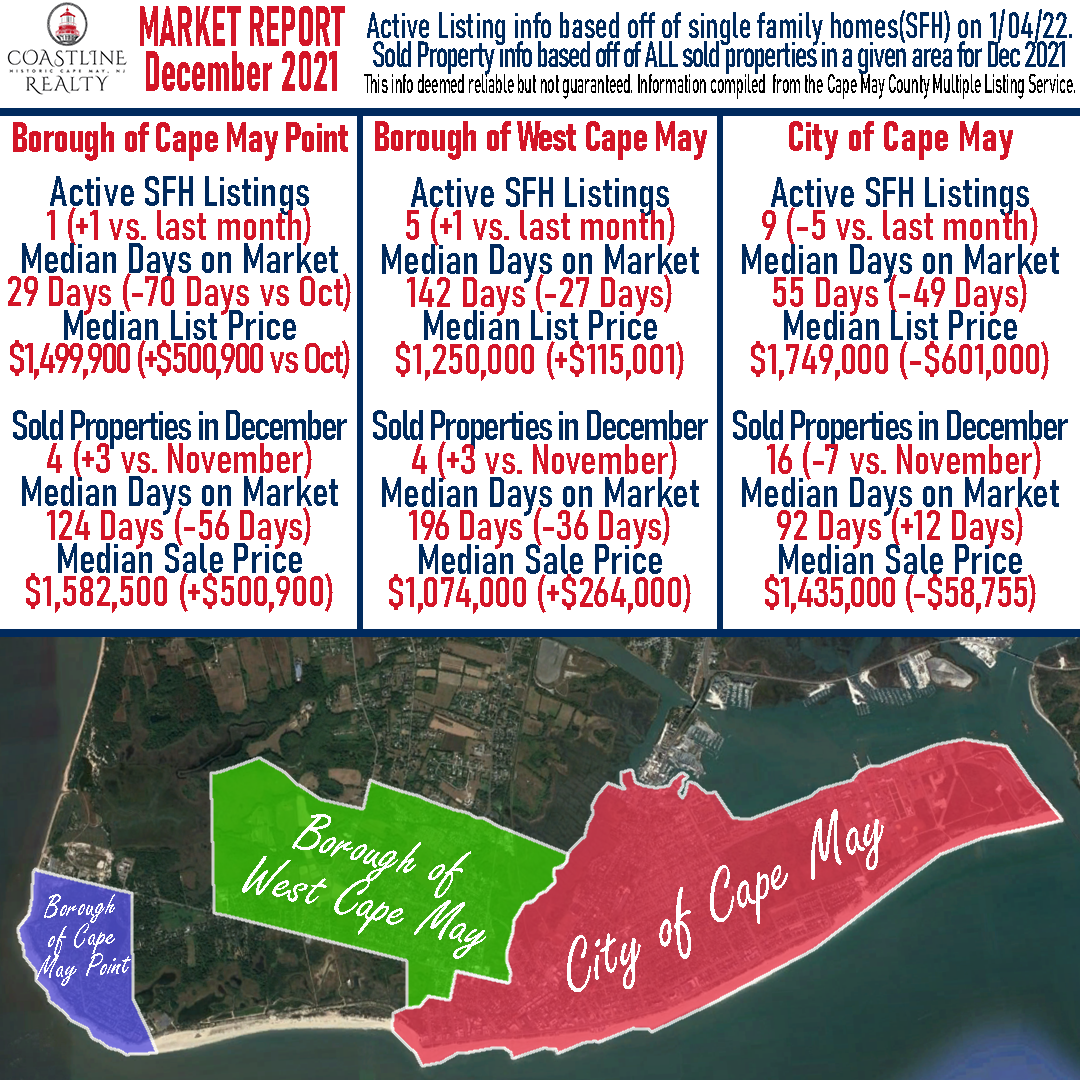
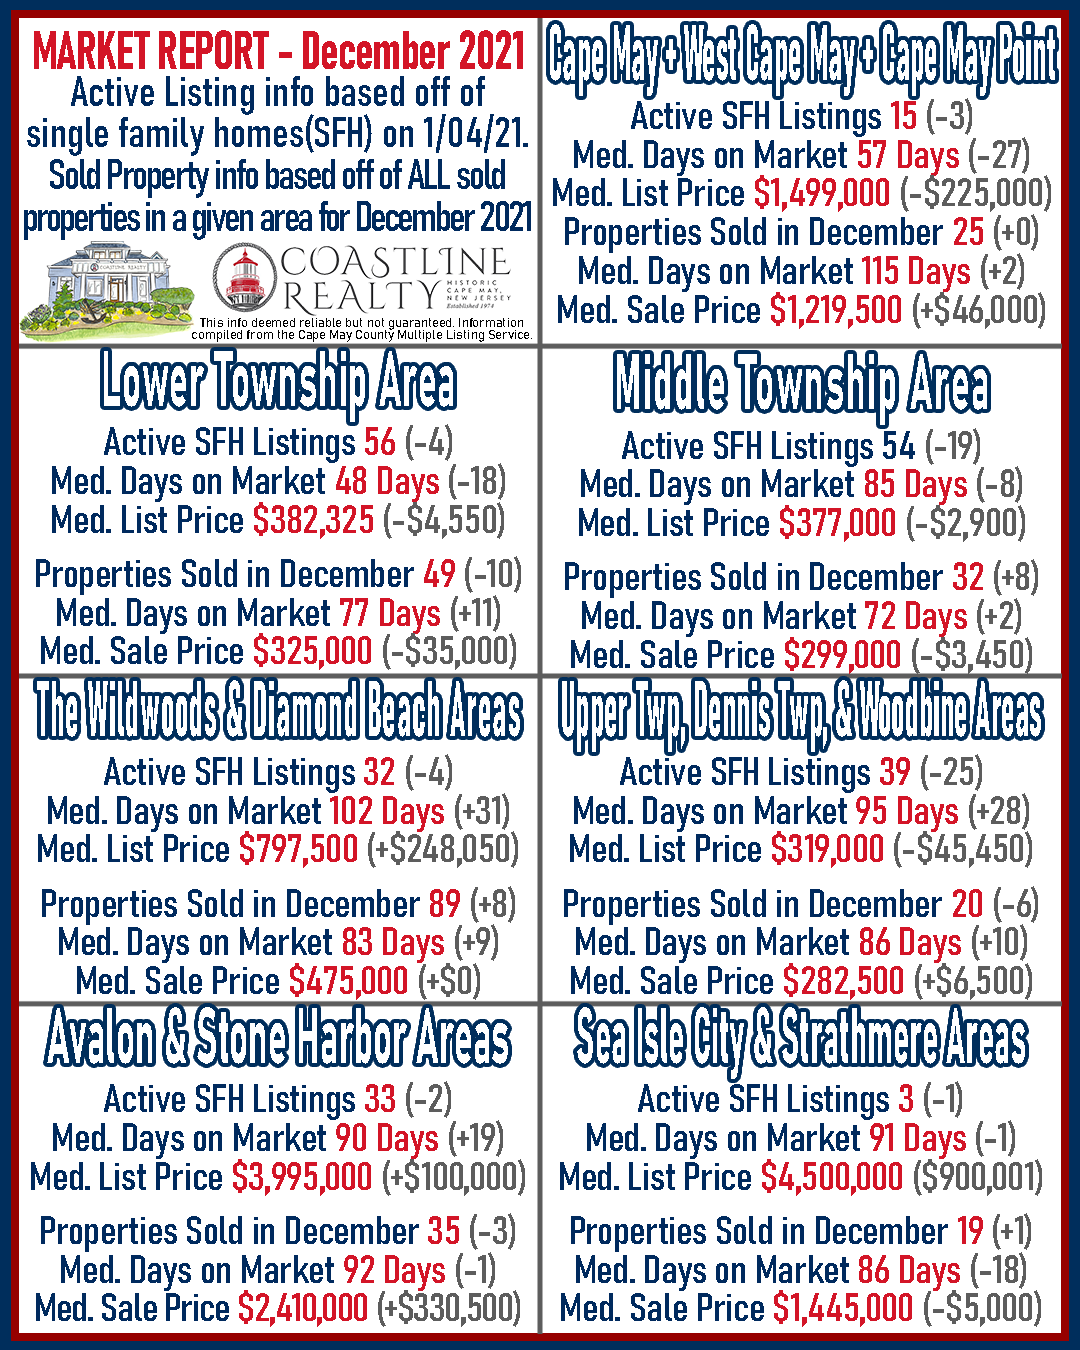
Cape May Area (including Cape May City – West Cape May – Cape May Point)
Active SFH Listings as of 4/02/22 – 20 (+7 vs. last month)
Median Days on Market – 27 Days (-7 Days vs. last month)
Median List Price – $1,724,000 (-$26,000 vs. last month)
Sold Properties in March – 19 (+11 vs. last month)
Median Days on Market – 107 Days (-5 days vs. last month)
Median Sale Price – $918,770 (+$156,270 vs. last month)
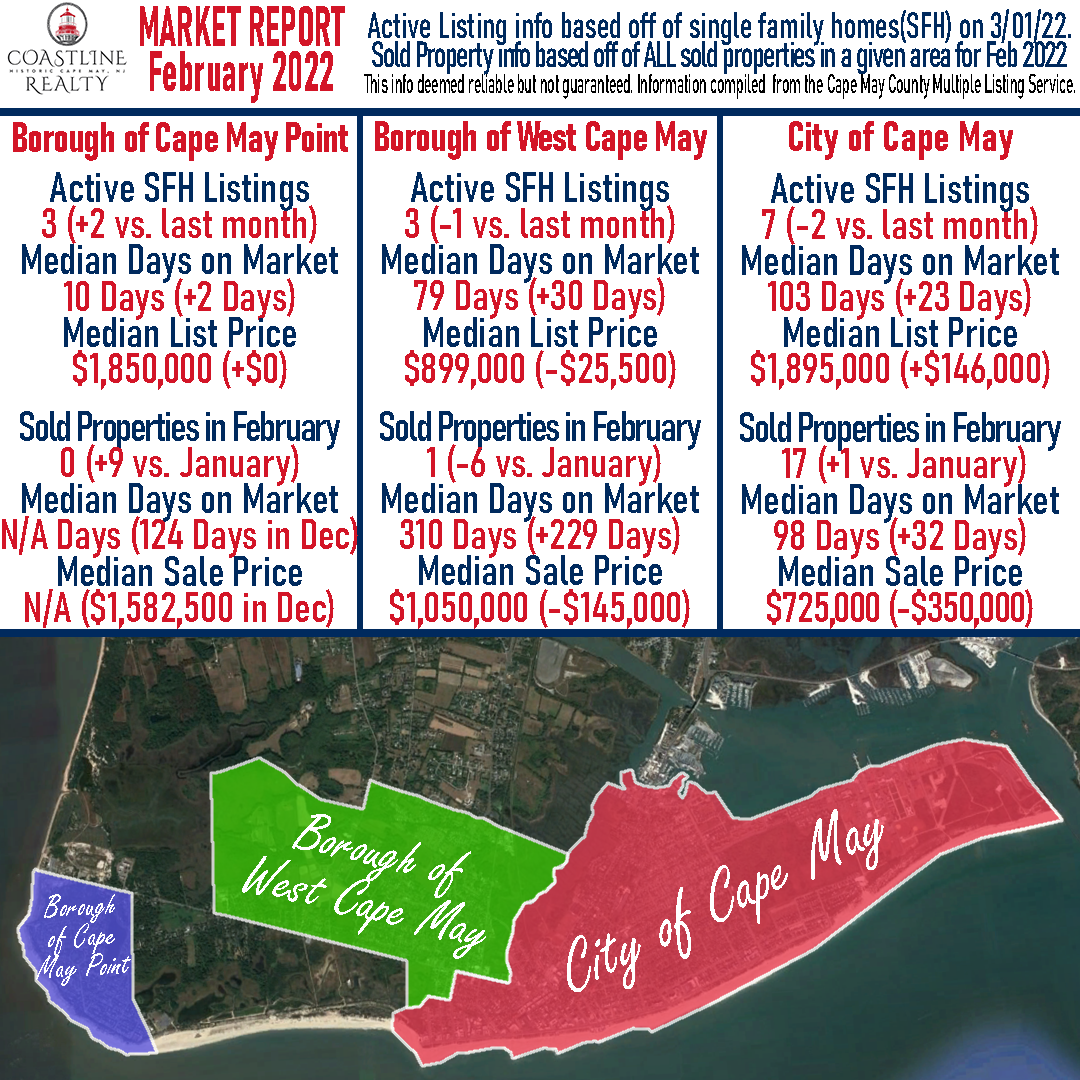
Cape May
Active SFH Listings as of 4/02/22 – 12 (+5 vs. last month)
Median Days on Market – 21 Days (-82 days vs. last month)
Median List Price – $1,995,000 (+$100,000 vs. last month)
Sold Properties in March – 15 (+8 vs. last month)
Median Days on Market – 107 Days (+9 days vs. last month)
Median Sale Price – $918,770 (+$193,770 vs. last month)
West Cape May
Active SFH Listings as of 4/02/22 – 7 (+4 vs. last month)
Median Days on Market – 31 Days (-48 days vs. last month)
Median List Price – $799,000 (-$100,000 vs. last month)
Sold Properties in March – 3 (+2 vs. last month)
Median Days on Market – 180 Days (-130 days vs. last month)
Median Sale Price – $860,000 (-$190,000 vs. last month)
Cape May Point
Active SFH Listings as of 4/02/22 – 1 (-2 vs. last month)
Median Days on Market – 64 Days (+64 Days vs. last month)
Median List Price – $1,850,000 (+$0 vs. last month)
Sold Properties in March – 1 (+1 vs. last month)
Median Days on Market – 17 Days (-107 Days vs. Dec.)
Median Sale Price – 2,170,750 (+$588,250 vs. Dec)
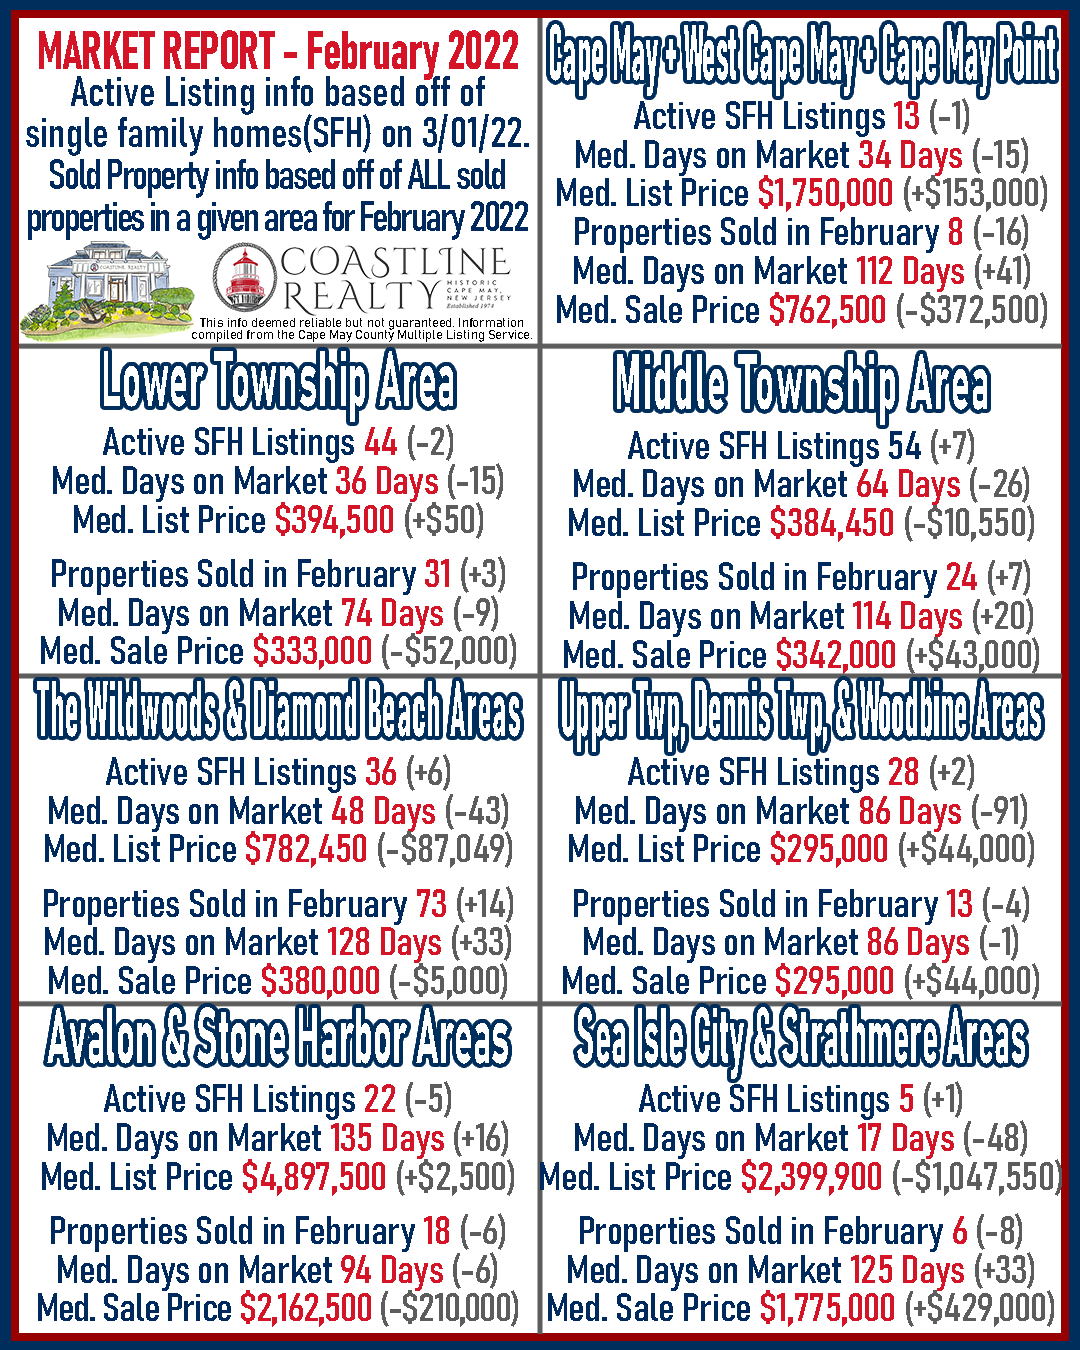
Lower Township
Active SFH Listings as of 4/02/22 – 50 (+6 vs. last month)
Median Days on Market – 17 Days (-19 days vs. last month)
Median List Price – $444,900 (+$50,400 vs. last month)
Sold Properties in March – 37 (+6 vs. last month)
Median Days on Market – 73 Days (-1 days vs. last month)
Median Sale Price – $360,000 (+$27,000 vs. last month)
Middle Township
Active SFH Listings as of 4/02/22 – 60 (+6 vs. last month)
Median Days on Market – 46 Days (-18 days vs. last month)
Median List Price – $442,450 (+$58,000 vs last month)
Sold Properties in March – 32 (+8 vs. last month)
Median Days on Market – 58 Days (-56 days vs. last month)
Median Sale Price – $335,000 (-$7,000 vs. last month)
The Wildwoods & Diamond Beach
Active SFH Listings as of 4/02/22 – 29 (-7 vs. last month)
Median Days on Market – 50 Days (+2 Days vs. last month)
Median List Price – $899,900 (+$117,450 vs. last month)
Sold Properties in March – 99 (+26 vs. last month)
Median Days on Market – 95 Days (-33 days vs. last month)
Median Sale Price – $445,000 (+$65,000 vs. last month)
Dennis Township – Upper Township – Woodbine
Active SFH Listings as of 4/02/22 – 22 (-6 vs. last month)
Median Days on Market – 63 Days (+11 days vs. last month)
Median List Price – $273,650 (-$71,300 vs. last month)
Sold Properties in March – 27 (+14 vs. last month)
Median Days on Market – 106 Days (+20 days vs. last month)
Median Sale Price – $390,000 (+$95,000 vs. last month)
Avalon & Stone Harbor
Active SFH Listings as of 4/02/22 – 28 (+6 vs. last month)
Median Days on Market – 39 Days (-96 days vs. last month)
Median List Price – $4,895,000 (-$2,500 vs. last month)
Sold Properties in March – 18 (+0 vs. last month)
Median Days on Market – 60 Days (-34 days vs. last month)
Median Sale Price – $2,177,500 (+$15,000 vs. last month)
Sea Isle City & Strathmere
Active SFH Listings as of 4/02/22 – 4 (-1 vs. last month)
Median Days on Market – 44 Days (+27 days vs. last month)
Median List Price – $2,527,499 (+$127,599 vs. last month)
Sold Properties in March – 23 (+17 vs. last month)
Median Days on Market – 139 Days (+14 days vs. last month)
Median Sale Price – $1,500,000 (-$275,000 vs. last month)
Are you looking to sell your property. Or are you curious about what it’s market value is? Give us a call at 609-884-5005 or inquire on our website. https://www.coastlinerealty.com/real-estate/selling-your-property
This info deemed reliable but not guaranteed. Information compiled from the Cape May County Multiple Listing Service.