Real Estate Market Recap – Cape May County – December 2022

Market Report! Here’s a quick Real Estate market report of most of Cape May County. Included is a recap of all sold properties(SFH, Land, Condo, etc) in the month of December 2022 for a given area; as well as a current look at the current inventory of residential single family homes(SFH) in an area as of January 2nd, 2022.

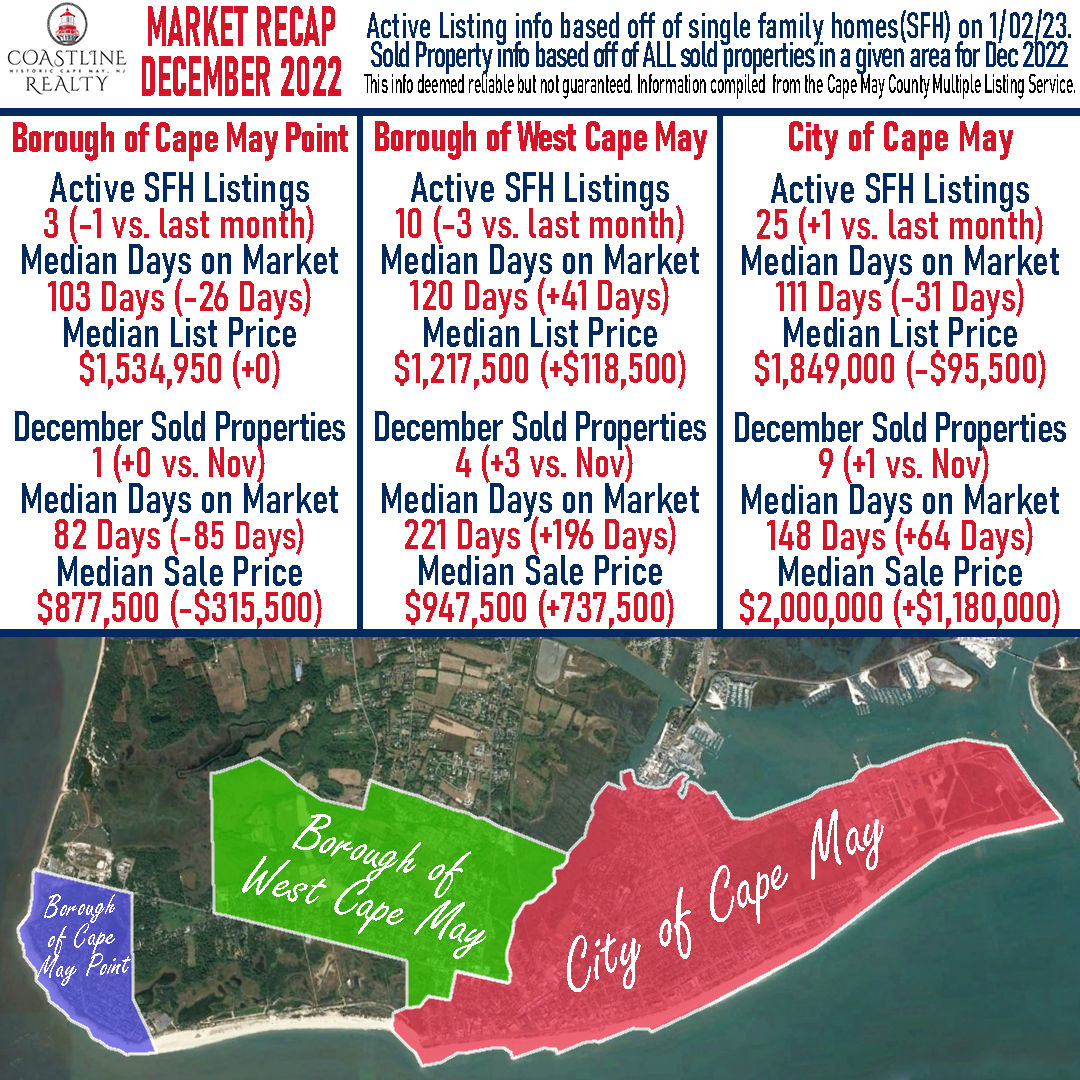
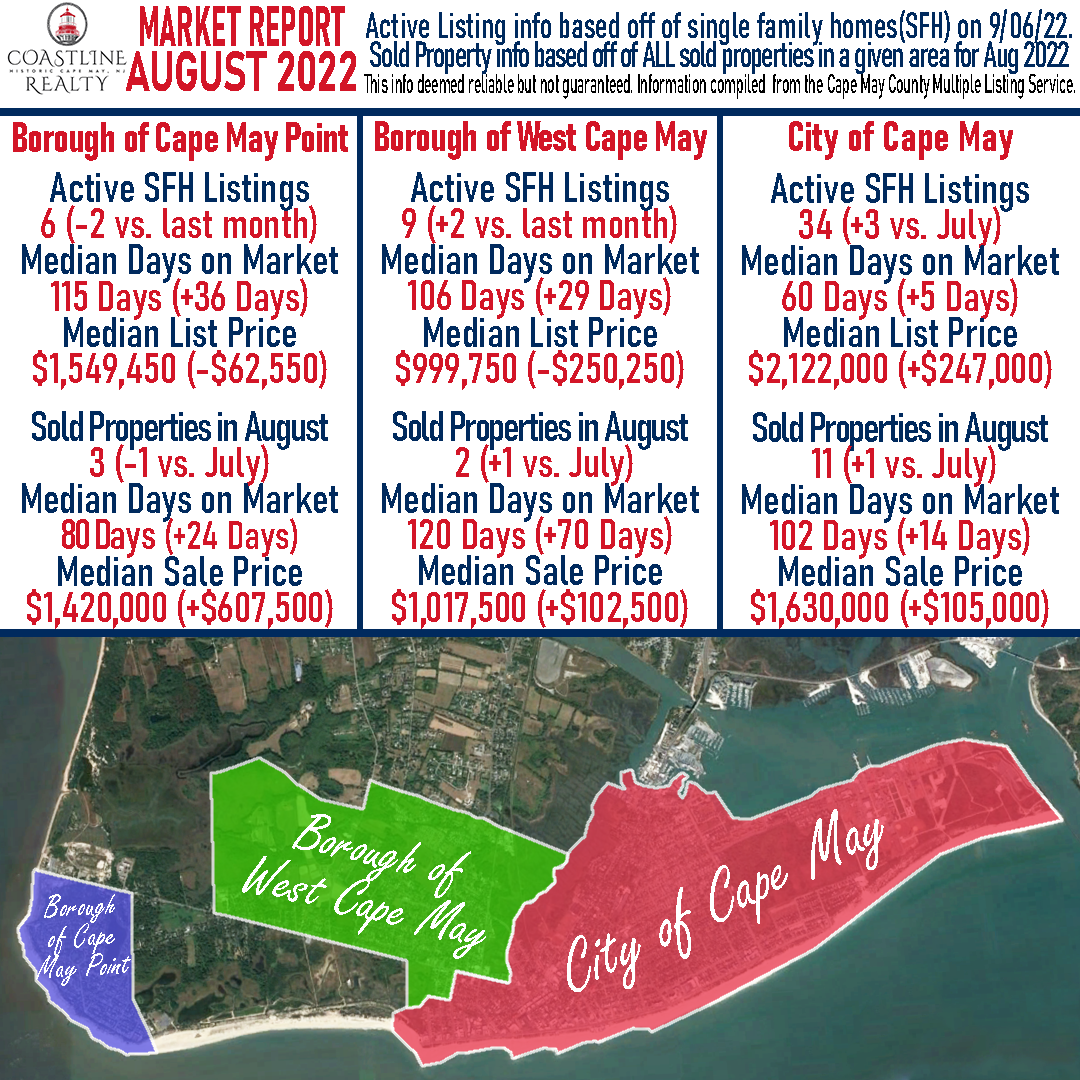
In December, the City of Cape May, West Cape May, and Cape May Point saw a slight uptick in the number of properties that sold compared to November 2022. The median sale price rose significantly in the City of Cape May ($1,180,000) and West Cape May ($737,500) compared to Cape May Pint, which saw one single property, a vacant lot, sell for $877,500, leading to a decrease of $315,500 median sale price month over month.

To begin the New Year, the three areas’ active properties remain steady with minor changes to the median list price, days on the market, and number of listings. Historically inventory remains extremely low in each area.

Cape May

Active SFH Listings as of 01/02/23– 25 (+1 vs. last month)

Median Days on Market – 111 Days (-31 days vs. last month)

Median List Price – $1,849,000 (-$95,500 vs. last month)

Sold Properties in December – 9 (+1 vs. last month)

Median Days on Market – 148 Days (+64 days vs. last month)

Median Sale Price – $2,000,000 (+$1,180,000 vs. last month)

West Cape May

Active SFH Listings as of 01/02/23– 10 (-3 vs. last month)

Median Days on Market – 120 Days (+41 days vs. last month)

Median List Price – $1,217,500 (+$118,500 vs. last month)

Sold Properties in December – 4 (+3 vs. last month)

Median Days on Market – 221 Days (+196 days vs. last month)

Median Sale Price – $947,500 (+737,500 vs. last month)

Cape May Point

Active SFH Listings as of 01/02/23– 3 (-1 vs. last month)

Median Days on Market – 103 Days (-26 Days vs. last month)

Median List Price – $1,534,950 (+$0 vs. last month)

Sold Properties in December – 1 (+0 vs. last month)

Median Days on Market – 82 (-85 Days vs. last month)

Median Sale Price – $877,500 (-$315,500 vs. last month)

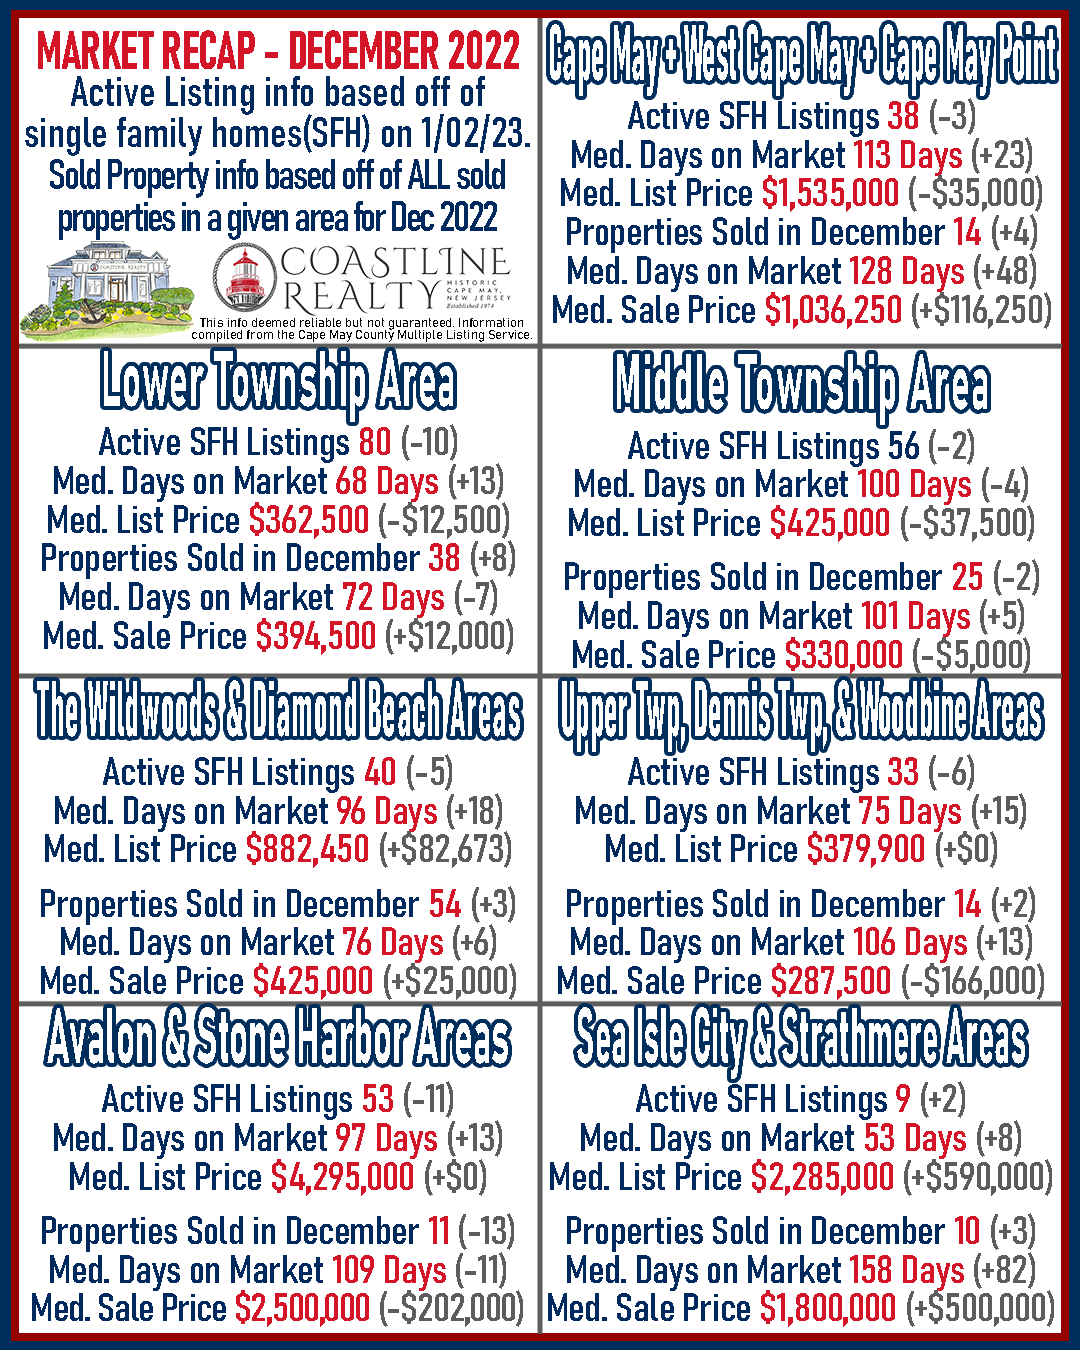
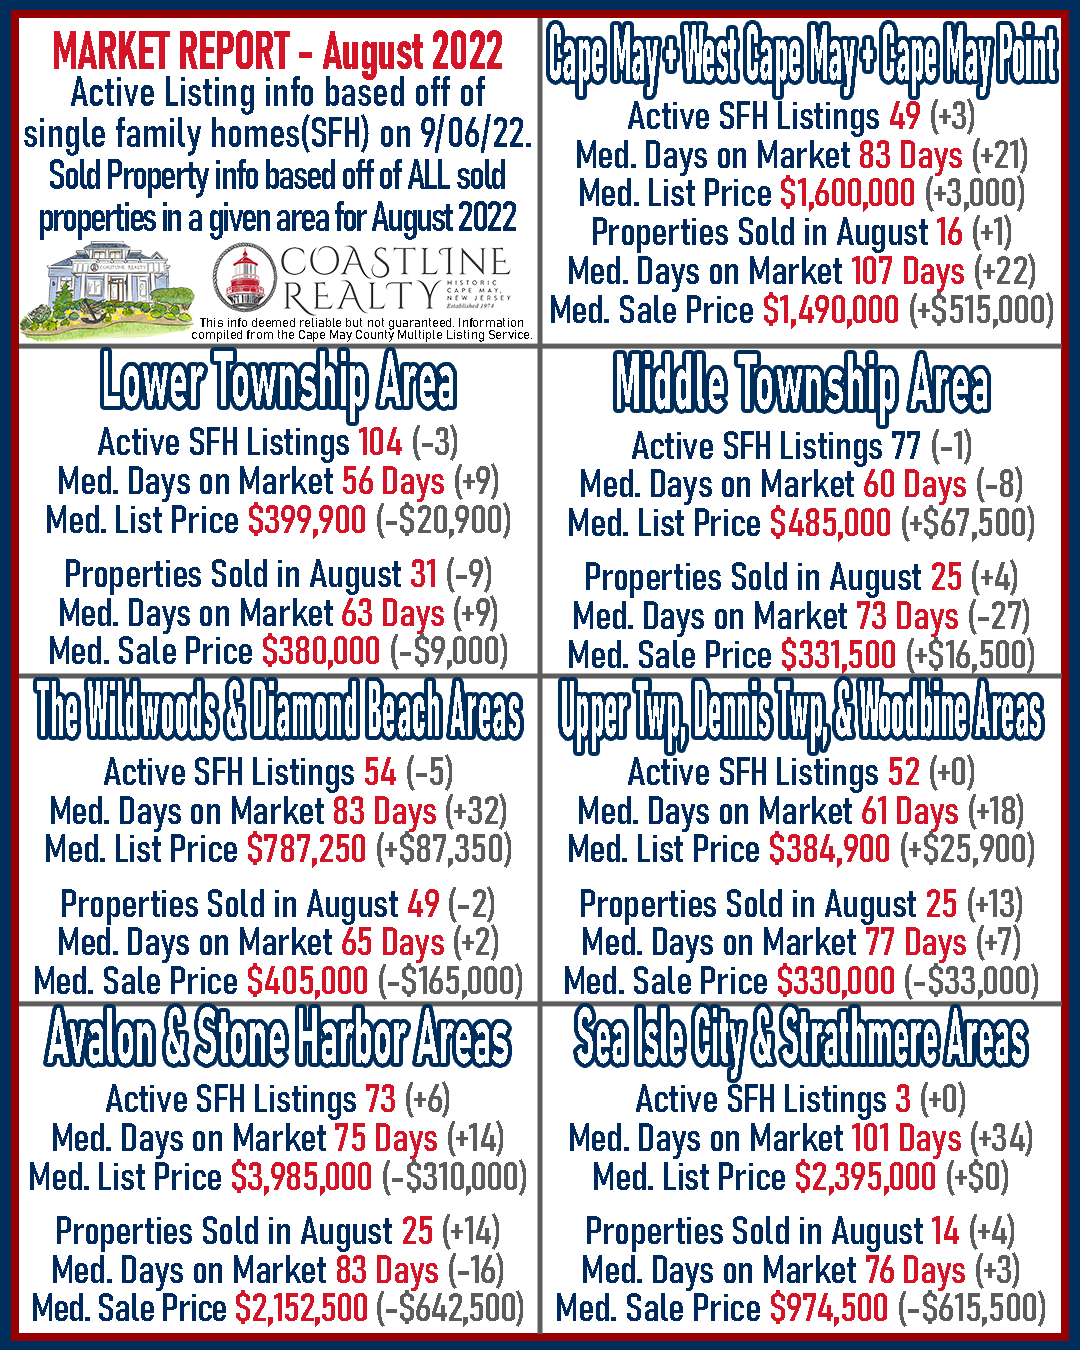
Across Cape May County the trend to begin 2023 is lower inventory in almost every area tracked and slightly longer days on the market. Current inventory remains low, and the winter months typically have less available inventory. Days on market rose slightly in most areas aside from Middle Township and median listing prices remained primarily steady beside Sea Isle City / Strathmere with a significant $590,000 increase.

In December, there was no clearly defined trend looking at Cape May County as a whole. Notably, the Cape May area saw the number of properties and median sale price increase significantly alongside Sea Ilse City/Strathmere. Meanwhile, Upper Twp/Dennis Twp/Woodbine Areas saw a significant decrease in the median sale price for the month compared to November 2022.

Cape May Area (including Cape May City – West Cape May – Cape May Point)

Active SFH Listings as of 01/02/23– 38 (-3 vs. last month)

Median Days on Market – 113 Days (+23 Days vs. last month)

Median List Price – $1,535,000 (-$35,000 vs. last month)

Sold Properties in December – 14 (+4 vs. last month)

Median Days on Market – 128 Days (+48 days vs. last month)

Median Sale Price – $1,036,250 (+$116,250 vs. last month)

Lower Township

Active SFH Listings as of 01/02/23– 80 (-10 vs. last month)

Median Days on Market – 68 Days (+13 days vs. last month)

Median List Price – $362,500 (-$12,500 vs. last month)

Sold Properties in December – 38 (+8 vs. last month)

Median Days on Market – 72 Days (-7 days vs. last month)

Median Sale Price – $394,500 (+$12,000 vs. last month)

Middle Township

Active SFH Listings as of 01/02/23– 56 (-2 vs. last month)

Median Days on Market – 100 Days (-4 days vs. last month)

Median List Price – $425,000 (-$37,500 vs last month)

Sold Properties in December – 25 (-2 vs. last month)

Median Days on Market – 101 Days (+5 days vs. last month)

Median Sale Price – $330,000 (-$5,000 vs. last month)

The Wildwoods & Diamond Beach

Active SFH Listings as of 01/02/23– 40 (-5 vs. last month)

Median Days on Market – 96 Days (+18 Days vs. last month)

Median List Price – $882,450 (+82,673 vs. last month)

Sold Properties in December – 54 (+3 vs. last month)

Median Days on Market – 76 Days (+6 days vs. last month)

Median Sale Price – $425,000 (+$25,000 vs. last month)

Dennis Township – Upper Township – Woodbine

Active SFH Listings as of 01/02/23– 33 (-6 vs. last month)

Median Days on Market – 75 Days (+15 days vs. last month)

Median List Price – $379,900 (+$0 vs. last month)

Sold Properties in December – 14 (+2 vs. last month)

Median Days on Market – 106 Days (+13 days vs. last month)

Median Sale Price – $287,500 (-$166,000 vs. last month)

Avalon & Stone Harbor

Active SFH Listings as of 01/02/23– 53 (-11 vs. last month)

Median Days on Market – 97 Days (+13 days vs. last month)

Median List Price – $4,295,000 (+$0 vs. last month)

Sold Properties in December – 11 (-13 vs. last month)

Median Days on Market – 109 Days (-11 days vs. last month)

Median Sale Price – $2,500,000 (-$202,000 vs. last month)

Sea Isle City & Strathmere

Active SFH Listings as of 01/02/23– 9 (+2 vs. last month)

Median Days on Market – 53 Days (+8 days vs. last month)

Median List Price – $2,285,000 (+$590,000 vs. last month)

Sold Properties in December – 10 (+3 vs. last month)

Median Days on Market – 158 Days (+82 days vs. last month)

Median Sale Price – $1,800,000 (+$500,000 vs. last month)

Are you looking to sell your property. Or are you curious about what it’s market value is? Give us a call at 609-884-5005 or inquire on our website. https://www.coastlinerealty.com/real-estate/selling-your-property

This info deemed reliable but not guaranteed. Information compiled from the Cape May County Multiple Listing Service.

Real Estate Market Report – Cape May County – August 2022

Market Report! Here’s a quick Real Estate market report of most of Cape May County. Included is a recap of all sold properties(SFH, Land, Condo, etc) in the month of July 2022 for a given area; as well as a current look at the current inventory of residential single family homes(SFH) in an area as of September 6th, 2022

In the month of August, the City of Cape May saw a notable rise in median list price in the amount of $247,000 compared to the previous month. West Cape May & Cape May Point both saw the median list price drop for the month compared to the previous month.

Days on Market for active properties to start off September rose significantly besides the City of Cape May that only saw a modest 5 day increase. For all three areas the median sale price rose noticeably, especially in Cape May Point that saw a $607,500 increase compared to July.

Cape May

Active SFH Listings as of 9/06/22– 34 (+3 vs. last month)

Median Days on Market – 60 Days (+5 days vs. last month)

Median List Price – $2,122,000 (+$247,000 vs. last month)

Sold Properties in August – 11 (+1 vs. last month)

Median Days on Market – 102 Days (+14 days vs. last month)

Median Sale Price – $1,630,000 (+$105,000 vs. last month)

West Cape May

Active SFH Listings as of 9/06/22– 9 (+2 vs. last month)

Median Days on Market – 106 Days (+29 days vs. last month)

Median List Price – $999,750 (-$250,250 vs. last month)

Sold Properties in August – 2 (+1 vs. last month)

Median Days on Market – 120 Days (+70 days vs. last month)

Median Sale Price – $1,017,500 (+$102,500 vs. last month)

Cape May Point

Active SFH Listings as of 9/06/22– 6 (-2 vs. last month)

Median Days on Market – 115 Days (+36 Days vs. last month)

Median List Price – $1,549,450 (-$62,550 vs. last month)

Sold Properties in August – 3 (-1 vs. last month)

Median Days on Market – 80 (+24 Days vs. last month)

Median Sale Price – $1,420,000 (+$607,500 vs. last month)

Across Cape May County to begin September there wasn’t a huge shift in active listings compared to July. Most areas saw a rise in median days on market, but otherwise sale prices and the number of active listings remained steady.

Properties that sold in August for most of of the county aside from the Cape May Area and Middle Township saw drops in the median sale prices month-over-month. The number of properties increased in most areas in the county as well aside from Lower Township and the Wildwoods/Diamond Beach.

Cape May Area (including Cape May City – West Cape May – Cape May Point)

Active SFH Listings as of 9/06/22– 49 (+3 vs. last month)

Median Days on Market – 83 Days (+21 Days vs. last month)

Median List Price – $1,600,000 (+$3,000 vs. last month)

Sold Properties in August – 16 (+1 vs. last month)

Median Days on Market – 107 Days (+22 days vs. last month)

Median Sale Price – $1,490,000 (+$515,000 vs. last month)

Lower Township

Active SFH Listings as of 9/06/22– 104 (-3 vs. last month)

Median Days on Market – 56 Days (+9 days vs. last month)

Median List Price – $399,900 (-$20,900 vs. last month)

Sold Properties in August – 31 (-9 vs. last month)

Median Days on Market – 63 Days (+9 days vs. last month)

Median Sale Price – $380,000 (-$9,000 vs. last month)

Middle Township

Active SFH Listings as of 9/06/22– 77 (-1 vs. last month)

Median Days on Market – 60 Days (-8 days vs. last month)

Median List Price – $485,000 (+$67,500 vs last month)

Sold Properties in August – 25 (+4 vs. last month)

Median Days on Market – 73 Days (-27 days vs. last month)

Median Sale Price – $331,500 (+$16,500 vs. last month)

The Wildwoods & Diamond Beach

Active SFH Listings as of 9/06/22– 54 (-5 vs. last month)

Median Days on Market – 83 Days (+32 Days vs. last month)

Median List Price – $787,250 (+$87,350 vs. last month)

Sold Properties in August – 49 (-2 vs. last month)

Median Days on Market – 65 Days (+2 days vs. last month)

Median Sale Price – $405,000 (-$165,000 vs. last month)

Dennis Township – Upper Township – Woodbine

Active SFH Listings as of 9/06/22– 52 (+0 vs. last month)

Median Days on Market – 61 Days (+18 days vs. last month)

Median List Price – $384,900 (+$25,900 vs. last month)

Sold Properties in August – 25 (+13 vs. last month)

Median Days on Market – 77 Days (+7 days vs. last month)

Median Sale Price – $330,000 (-$33,000 vs. last month)

Avalon & Stone Harbor

Active SFH Listings as of 9/06/22– 73 (+6 vs. last month)

Median Days on Market – 75 Days (+14 days vs. last month)

Median List Price – $3,985,000 (-$310,000 vs. last month)

Sold Properties in August – 25 (+14 vs. last month)

Median Days on Market – 83 Days (-16 days vs. last month)

Median Sale Price – $2,152,500 (-$642,500 vs. last month)

Sea Isle City & Strathmere

Active SFH Listings as of 9/06/22– 3 (+0 vs. last month)

Median Days on Market – 101 Days (+34 days vs. last month)

Median List Price – $2,395,000 (+0 vs. last month)

Sold Properties in August – 14 (+4 vs. last month)

Median Days on Market – 76 Days (+3 days vs. last month)

Median Sale Price – $974,500 (-$615,500 vs. last month)

Are you looking to sell your property. Or are you curious about what it’s market value is? Give us a call at 609-884-5005 or inquire on our website. https://www.coastlinerealty.com/real-estate/selling-your-property

This info deemed reliable but not guaranteed. Information compiled from the Cape May County Multiple Listing Service.

Villas, NJ – Market Recap 2016-2021 – Average Sale Price

Villas, New Jersey is located with Lower Township at the southern tip of Cape May County. The area is primarily residential and consisting of single family homes. Businesses & commercial properties are concentered along the main road bisecting Villas called Bayshore Road. Take a look at Villas real estate market trends below for the average sale price and the number of properties having been sold in Villas from 2016 to 2021.

2021 saw the average selling price of a Villas property rise dramatically by $68,134 (26.7%) compared to 2020’s average sale price. Compared to 2016 the average selling price has risen by nearly 103% / $163,649!!! During this time the number of properties selling has risen from 220 in 2016 and peaking at 327 in 2020.

In 2021 the number of properties sold dropped slightly to 308 due to low inventory. The number of properties coming onto the market dipped and was far outpaced by the number of buyers looking to purchase in the area.

Above is a look at the Cape May Beach area located within Villas. This specific area is the southern most portion of Villas and is nestled between the Delaware Bay and Cox Hall Creek Wildlife Management area. Much like the greater Villas area, Cape May Beach saw a dramatic rise in property values starting in 2020 and peaking in 2021.

The average sale price skyrocketed by 50.7% / $230,529 between 2020 and 2021. The number of properties sold lowered slightly from 27 down to 22 between the two years.

Are you a homeowner in the area thinking of selling? Or just curious on your property’s market value? Give us a call at 609-884-5005 or inquire at info@coastlinerealty.com, or contact one of our agents directly at this link: https://www.coastlinerealty.com/our-agents.

We are Cape May’s top selling real estate office (2012-2021). We can get you the best offers for your home! Call us today to see the Coastline difference and how we can take you from LISTED to SOLD!!

Date provided in this article was taken from the Cape May County Multiple Listing System and is considered accurate, but no guaranteed.

Real Estate Market Report – June 2020 – Cape May County

Market Report! Here’s a quick rundown of most of Cape May County for the month of June 2020. Included is new listings, sold properties, and total active listings at the end of the month.


The Market on FIRE!!!! Currently for sale property supply is extremely low with very high demand! Now’s the perfect time if you were considering selling your property to give your favorite Coastline agent or our office a call for a CMA to see how much your property is worth!


Cape May + West Cape May + Cape May Point


97 Total Active Listings as of July 1st    (-25 vs last month)

Avg Price of $1,055,685

Median Days on market = 155 Days


20 New Listings (-2 vs last month)

Avg Price of $1,129,590


22 Sold Houses (+7 vs last month)

Avg Price of $799,100


Lower Township Area


183 Active Listings as of July 1st (-33 vs last month)

Avg Price of $379,886

Median Days on Market = 116 Days


47 New Listings (+12 vs last month)

Average Price of $382,597


60 Sold Houses (+19vs last month)

Avg Price of $314,734


Middle Township Area


253 Total Active Listings as of July 1st (same as last month)

Avg Price of $324,877

Median Days on Market = 141 Days


60 new Listings (+17 vs last month)

Avg Price of $314,138


34 Sold Houses (+7 vs last month)

Avg Price of $257,420


Wildwoods

337 Total Active Listings as of July 1st (-106 vs last month)

Avg Price of $578,545

Median Days on Market = 137 Days


71 New Listings (-1 vs last month)

Avg Price of $486,820


90 Sold Houses (+32 vs last month)

Avg Price of $410,130


Upper & Dennis & Woodbine Areas


158 Total Active Listings (-16 vs last month)

Avg Price of $261,865

Median Days on Market = 122 Days


20 New Listings (-10 vs last month)

Avg Price of $247,804


27 Sold Houses (+8 vs last month)

Avg Price of $173,418


Are you looking to sell your property. Or are you curious about what it’s market value is? Give us a call at 609-884-5005 or inquire on our website. https://www.coastlinerealty.com/real-estate/selling-your-property


This info deemed reliable but not guaranteed. Information compiled from the Cape May County Multiple Listing Service.


Real Estate Market Report – May 2020 – Cape May County

Market Report! Here’s a quick rundown of most of Cape May County for the month of May 2020. Included is new listings, sold properties, and total active listings at the end of the month.


Cape May + West Cape May + Cape May Point


122 Total Active Listings as of June 1st

Avg Price of $1,001,757

Median Days on market = 145 Days


22 New Listings (+15 vs last month)

Avg Price of $917,309


15 Sold Houses (-2 vs last month)

Avg Price of $1,254,725


Lower Township Area


215 Active Listings

Avg Price of $356,365

Median Days on Market = 121 Days


35 New Listings (+10 vs last month)

Average Price of $337,796


41 Sold Houses (-16 vs last month)

Avg Price of $299,060


Middle Township Area


253 Total Active Listings

Avg Price of $316,718

Median Days on Market = 151 Days


43 new Listings (+18 vs last month)

Avg Price of $283,365


27 Sold Houses (-15 vs last month)

Avg Price of $246,466


Wildwoods

443 Total Active Listings

Avg Price of $539,902

Median Days on Market = 125 Days


72 New Listings (+23 vs last month)

Avg Price of $510,717


58 Sold Houses (-34 vs last month)

Avg Price of $431,803


Upper & Dennis & Woodbine Areas


174 Total Active Listings

Avg Price of $268,912

Median Days on Market = 109 Days


30 New Listings (+8 vs last month)

Avg Price of $204,499


19 Sold Houses (-2 vs last month)

Avg Price of $241,442


Are you looking to sell your property. Or are you curious about what it’s market value is? Give us a call at 609-884-5005 or inquire on our website. https://www.coastlinerealty.com/real-estate/selling-your-property
 
This info deemed reliable but not guaranteed. Information compiled from the Cape May County Multiple Listing Service.

Real Estate Market Report – April 2020 – Cape May County

Market Report! Here’s a quick rundown of most of Cape May County for the month of April 2020. Included is new listings, sold properties, and total active listings at the end of the month.
 
Cape May Area
7 New Listings (-11 vs last month)
Average Price = $971,678
 
13 Sold Properties (-2 vs. last month)
Average Price = $785,400
 
81 Active Listings as of 4/30
Average Price = $1,074,075
Median days on market = 113 Days
 
Lower Township Area
32 New Listings (-32 vs. last month)
Average Price = $301,206
 
57 Sold Properties (-8 vs. last month)
Average Price = $276,039
 
225 Active Listings as of 4/30
Average Price = $310,103
Median days on market = 62 Days
 
Middle Township Area
25 New Listings (-5 vs. last month)
Average Price = $258,819
 
42 Sold Properties (+20 vs. last month)
Average Price = $239,089
 
191 Active Listings of as 4/30
Average Price = $299,427
Median days on market = 110 Days
 
The Wildwoods
49 New Listings (-27 vs. last month)
Average Price of $329,891
 
92 Sold Properties (-1 vs. last month)
Average price of $432,655
 
119 Active Listings
Average price of $581,230
Median days on market = 93 Days
 
Upper Township, Dennis, & Woodbine
22 New Listings (-9 vs. last month)
Average Price = $248,231
 
21 Sold Properties (-1 vs. last month)
Average Price = $256,528
 
119 Active Listings
Average Price = $272,264
Median days on market = 99 Days
 
Are you looking to sell your property. Or are you curious about what it’s market value is? Give us a call at 609-884-5005 or inquire on our website. https://www.coastlinerealty.com/real-estate/selling-your-property
 
This info deemed reliable but not guaranteed. Information compiled from the Cape May County Multiple Listing Service.

Real Estate Market Report – March 2020 – Cape May County

Market Report! Here’s a quick rundown of most of Cape May County for the month of March 2020. Included is new listings, sold properties, and total active listings at the end of the month.

Cape May Area
18 New Listings
Average Price = $748,477

15 Sold Properties
Average Price = $781,333

129 Active Listings as of 4/1
Average Price = $1,071,572
Median days on market = 139 Days

Lower Township Area
65 New Listings
Average Price = $348,035

49 Sold Properties
Average Price = $344,979

243 Active Listings as of 4/1
Average Price = $346,053
Median days on market = 180 Days

Middle Township Area
30 New Listings
Average Price = $317,180

22 Sold Properties
Average Price = $199,298

280 Active Listings of as 4/1
Average Price = $310,002
Median days on market = 140 Days

The Wildwoods
76 New Listings
Average Price of $401,479

93 Sold Properties
Average price of $328,643

492 Active Listings
Average price of $557,452
Median days on market = 121 Days

Upper Township, Dennis, & Woodbine
31 New Listings
Average Price = $221,454

22 Sold Properties
Average Price = $254,836

187 Active Listings
Average Price = $266,029
Median days on market = 120 Days

Are you looking to sell your property. Or are you curious about what it’s market value is? Give us a call at 609-884-5005 or inquire on our website. https://www.coastlinerealty.com/real-…/selling-your-property

This info deemed reliable but not guaranteed. Information compiled from the Cape May County Multiple Listing Service.

Saint Joseph’s Home Selling Kit – Part 2

Sales of the Saint Joseph Home Sellers Kits have been brisk of late. One mid-West hardware store reports last year’s sales up over 50% to over 120,000 units. A Modesto California mortgage broker and statue distributor reports a 100% annual increase in sales for three consecutive years. His best customers are Realtors and Real Estate Auctioneers.

For those who shop locally, a short ride takes you to Lamb’s Book Store in North Wildwood. I asked proprietor Joseph Olwell if sales of the home seller’s kit have picked up since the real estate market tanked. He said sales have been “steady” but about 20 years or so ago, at the height of the last bear market in the Wildwoods, sales doubled after an article appeared in the local press about the use of the kit. Mr. Olwell, who has a business degree from Villanova, stocks two versions of the kit: the 3 1/2 inch basic, plastic “Chevy” and the taller full-color “Cadillac.” Apparently, General Motors has a commanding market share in religious statues. My editor is selling her house. For $4.40 I bought her a “Chevy.” As far as Saint Joseph is concerned, size does not matter. One should not buy a bigger statue for a larger home, or a smaller one for a one-bedroom condo. Beware of ads that promise better results using a bigger statue.

Saint Joseph is not the only incorporeal intermediary when it comes to asking a favor from above. Saint Anthony and Saint Jude are often asked to intercede on the behalf of people who might need a little heavenly juice. Saint Anthony of Padua is the patron saint of lost things.  In grade school it was not uncommon to pray to Saint Anthony to help find missing homework assignments. Not more than ten minutes after I typed this sentence I found a missing key belonging to one of my rental units. Saint Anthony statues have also been buried upside down in front of homes for sale. Is it possible a homeowner locked himself out? A Saint Anthony statue was recently found decapitated in the town of San Antonio, Texas. Irrational behavior is to be expected in bad times and Saint Anthony is not the only one who has lost his head in a down market. On the same page was an article about a teenager who set himself on fire while using gasoline on his head lice. Unless he was a Buddhist, I do not think this is real estate related.

Saint Jude is the patron saint of lose causes.  I might ask him to intercede in behalf of my retirement portfolio. Since October 2008, it might not be unreasonable to suggest a tandem of Saint Joseph and Saint Jude be enlisted in the sale of homes and in picking stocks. San Antonio could have used Saint Jude in 1836.

One of the hardest hit areas in the recent real estate slump has been Las Vegas. My “partner-cousin” Tom was there in the winter checking out the housing market.  He saw thousands and thousands of unsold condos listed for a fraction of their original prices.  70% discounts were not uncommon. The Arizona and Florida real estate market have also suffered incredible losses, with values down over 30%. One can picture future archeologists unearthing thousands of Saint Joseph statues from lawns and flower pots all over a landscape of unsold rubble, asking “What were these people thinking?”

Of course nothing is certain in real estate. As we go to press, my buyer’s home inspection report reads like a Russian novel. I was selling the home “as is” and now it looks like the deal is falling apart.  I may have to start all over again. Do I need another statue? Maybe, I should have asked Mr. Olwell where I can get the “Lexus.” In any event, at least something is selling. There’s always a bull market somewhere!

This is Wayne Piersanti, Broker-Salesperson for Coastline Realty, keeping it real. I can be reached at (609) 540-3374 and theshire3099@comcast.net. Coastline Realty is a full service, family owned and operated, award winning real estate agency.

Part 2 of 2.  Hope you enjoyed the article!

ORIGINALLY PUBLISHED IN CAPE MAY MAGAZINE, 2009


Saint Joseph’s Home Seller’s Kit – Part 1

On December 30th, 2008 I listed my duplex in Cape May for sale.  I knew the market was tight, and money was hard to come by. The nation – indeed the world – was approaching its third mouth of unprecedented downturns, bankruptcies, bailouts and foreclosures. Real estate had been in free fall for years. Since October we have seen a simultaneous contraction of all investment markets: Gold, the euro, mutual funds, stocks, everything!  For many years I had made money by betting against prevailing trends. When money poured into the stock market (driven by the dot.com delusions) in the late 1990’s, I bought real estate.  By 2005, when anyone with $300, a lawyer and a hammer could form an LLC and become a builder, I invested in global funds. When I didn’t have a clue what was going on, I turned to bourbon and CD’s (the money kind). Park your money there for a while, have a drink and wait for the dust to settle.

Still, in the mist of a decidedly bear housing market, I was trying to sell my old house in Cape May. For many years a family member had lived there, and when it became vacant the house was beat and needed a lot of work. I had to move on. I was confident it would sell. I had a secret advantage that I am about to share with you. I bought a “Saint Joseph’s Home Seller’s Kit.” For as little as $3.49, you can hire the “hardest working Saint in Real Estate.” Complete with a Saint Joseph statue, a color prayer card and instructions on how to use them both; the kit is also available in Spanish. If only indulgences could be bought so cheaply.

Ever since Saint Teresa of Avila  prayed that Saint Joseph would intercede to obtain land for Christian converts, real estate lore abounds with stories attesting to the remarkable skills of Saint Joseph the Carpenter when it comes to selling homes.  This was not the first time I had asked his intercession.

In 2006, when I listed my daughter’s house in Bayside Village, she buried a Saint Joseph statue there alongside the petunias. Her home sold in 82 days. In 2008 she lent her statue to a sister-in-law trying to sell her house in Villas, NJ.  Bad move. The house did not sell. Saint Joseph statue legend says that once a Saint Joseph statue has been used to sell a home, it should proceed with the sellers to their new home, where it should be prominently displayed. For this reason one should avoid the biodegradable Saint Joseph statue at all costs. At the least, the statue should be “retired.” Each sale situation is unique, and a new statue should be entrusted with any future business. Saint Joseph had a good union, and this is one way to keep statue sales up! Since the sister-in-law did not list with me, I blamed the realtor. I wanted to stay on Saint Joseph’s good side!

My hands shook when my kit arrived in the mail. Of course it was less than 20 degrees outside that day! Since the ground was frozen I had plenty of time to read the instructions, and plan my strategy.  I got a little confused when I read the instructions for burial of the statue. Apparently, there is no “one way” to use the Saint Joseph statue, and there exists a lot of latitude for the user.  Suggested options include: Bury the statue upside down next to the “for sale” sign, bury it 3 feet from the rear of the house, “simply” place it somewhere on the property, bury it next to the street facing the home, bury it next to the front door facing away from the home, bury it in the front yard, and bury it 8” to 12” deep. If the Catholic Church had been this accommodating centuries ago, there might not have been a Protestant Reformation. There were no instructions for selling a high-rise condo. The kit does not include a flower pot or planter. By the end of January, the ground had thawed enough for me to actually bury the statue. I buried Saint Joseph upside down, facing away from the home, in the front of the property. I asked a friend of mine to join me in prayer. He demurred and shouted obscenities at me while I prayed. Within three weeks, I had gotten two offers. I accepted the second.

Part 1 of 2.  To Be Continued Next Month!

ORIGINALLY PUBLISHED IN CAPE MAY MAGAZINE, 2009

Author:

WAYNE PIERSANTI

Broker Sales Associate
Email: theshire3099@comcast.net
Cell Phone: (609) 540-3374
Fax: (609) 884-4620

Greater Cape May 3rd Quarter Market Report – Condos & Townhomes

There were 23 condominium sales in the greater Cape May area during the 3rd quarter of 2019 ranging in price from $75,000 to $741,000.  Three units at the Marquis de Lafayette “condo-tel” sold for less than $100,000. (Owners of these units are required to rent their room(s) as a hotel room. The owner has access to use the room based on an allotted usage policy.) Located at 501 Beach Avenue, The Marquis de Lafayette complex overlooks the beach and features include a heated pool, a restaurant and the Barefoot Bar! Meanwhile, Unit #3 located at 41 Jackson Street sold for $672,500 after only 71 days on the market. It features 3 bedrooms and 2 baths. The building itself dates back to 1879.

In West Cape May, at 606 Second Avenue, a new townhome-style twin 4 bedroom, 3 ½ bath unit sold for $703,000. It was originally listed at $749,000.  This 2100 square foot side by side had been on the market for 347 days prior to closing. Closer to town a 2 bedroom, 1 ½ bath unit at 221 Park Blvd “E” sold for $350,000.

Off the island $741,000 got you a 3 bedroom, 2 ½ bath unit at the Canyon Club. This move-in ready, 1990 square foot condo came with a 50 foot deeded boat slip. An $8000 annual condo fee includes 3 pools, Harbor views and a marina. A 2 bedroom, 2 bath unit at Lighthouse Pointe Marina (5117 Shawcrest Road) sold for $145,000 as-is and with a laundry list of buyer’s responsibilities prior to closing and seller’s disclaimers. How many remember those endless summers of listening to Philly DJ Jerry Blavat at the Lighthouse Pointe Bar and Restaurant?

Currently there are 61 condominiums listed for sale in the greater Cape May area including a condo at the Marquis de Lafayette that has been on the market for an astonishing 3400 days! (Can this be a typo?) 37 of these are in Lower Township, including 10 at Canyon Club. A new side by side at 2685 Bay Drive is listed for $775,000. It has been on the market for 61 days. From all of us at Coastline Realty……Enjoy the Holidays and have a great time!

This is Wayne Piersanti, Broker-Salesperson for Coastline Realty, keeping it real. For information on any of these listings, I can be reached at (609) 540-3374 and theshire3099@comcast.net. Coastline Realty is a full service, family owned and operated, award winning real estate agency.

(Information was compiled from the Cape May Multiple Listing Service and deemed reliable but not guaranteed.)