Market Report! Here’s a quick Real Estate market report of most of Cape May County. Included is a recap of all sold properties(SFH, Land, Condo, etc) in the month of June 2022 for a given area; as well as a current look at the current inventory of residential single family homes(SFH) in an area as of July 2nd, 2022. Data is compiled from the Cape May County MLS and is deemed and accurate snapshot of the area’s market statistics, however does not include any sales outside of this MLS.
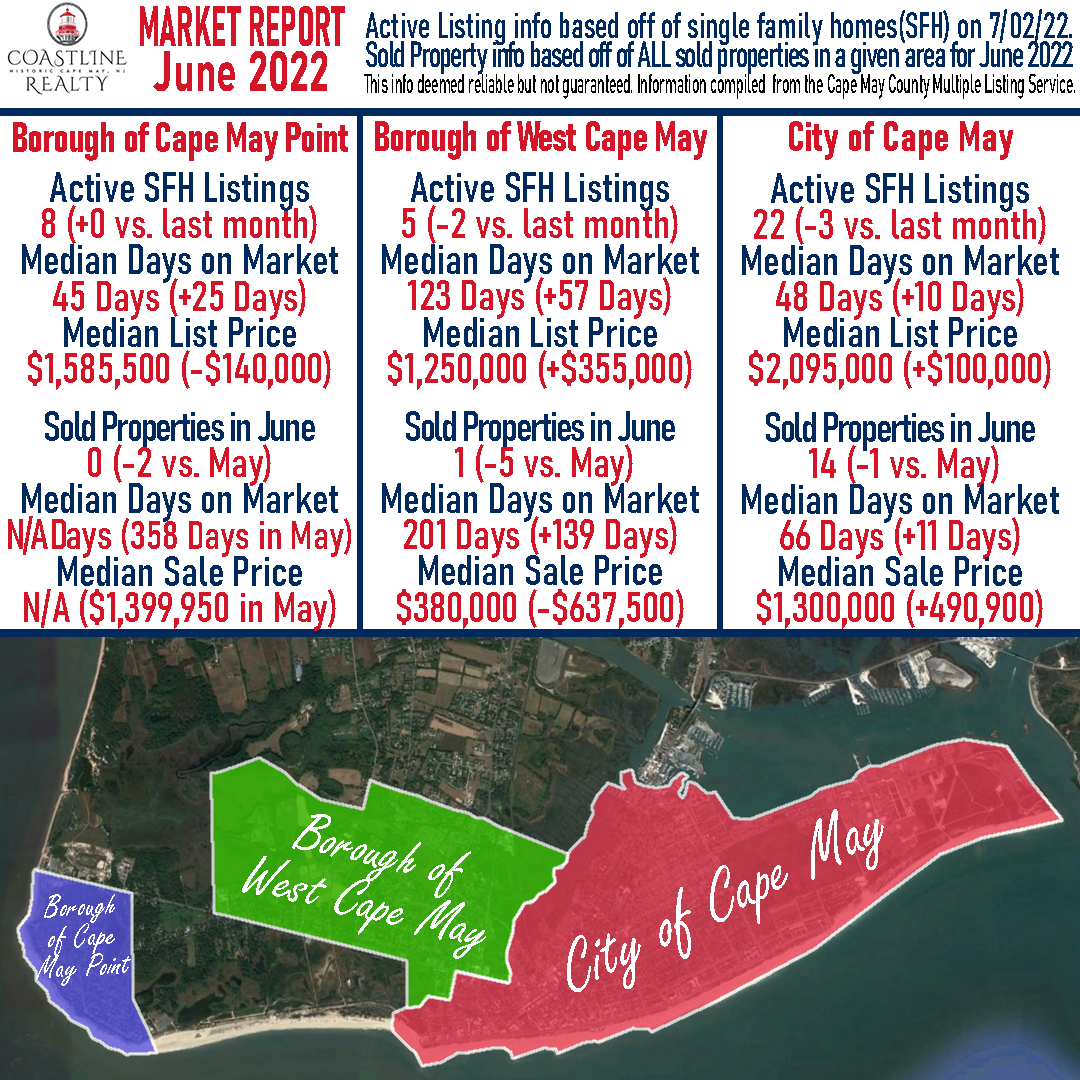
The trend in Cape May, West Cape May, and Cape May Point for the month of June was fewer properties closing than the month prior and to end the month less active properties on the market.
The City of Cape May saw the median list & sale price rise month over month. West Cape May saw a dramatic drop in median sale price, however given the small 1 sample size(1 property) this isn’t abnormal to see month-to-month. Lastly, Cape May Point saw no properties close in June which has happened several months over the past year+ given the low amount of inventory. The 8 active listings in Cape May Point for the second month in a row is the highest the area has seen in well over a year.
Cape May
Active SFH Listings as of 7/02/22 – 22 (-3 vs. last month)
Median Days on Market – 48 Days (+10 days vs. last month)
Median List Price – $2,095,000 (+$100,000 vs. last month)
Sold Properties in June – 14 (-1 vs. last month)
Median Days on Market – 66 Days (+11 days vs. last month)
Median Sale Price – $1,300,000 (+$490,900 vs. last month)
West Cape May
Active SFH Listings as of 7/02/22 – 5 (-2 vs. last month)
Median Days on Market – 123 Days (+57 days vs. last month)
Median List Price – $1,250,000 (+$355,000 vs. last month)
Sold Properties in June – 1 (-5 vs. last month)
Median Days on Market – 201 Days (+139 days vs. last month)
Median Sale Price – $380,000 (-$637,500 vs. last month)
Cape May Point
Active SFH Listings as of 7/02/22 – 8 (+0 vs. last month)
Median Days on Market – 47 Days (+25 Days vs. last month)
Median List Price – $1,585,500 (-$140,000 vs. last month)
Sold Properties in June – 0 (-2 vs. last month)
Median Days on Market – N/A (+358 Days in May)
Median Sale Price – N/A ($1,399,950 in May)
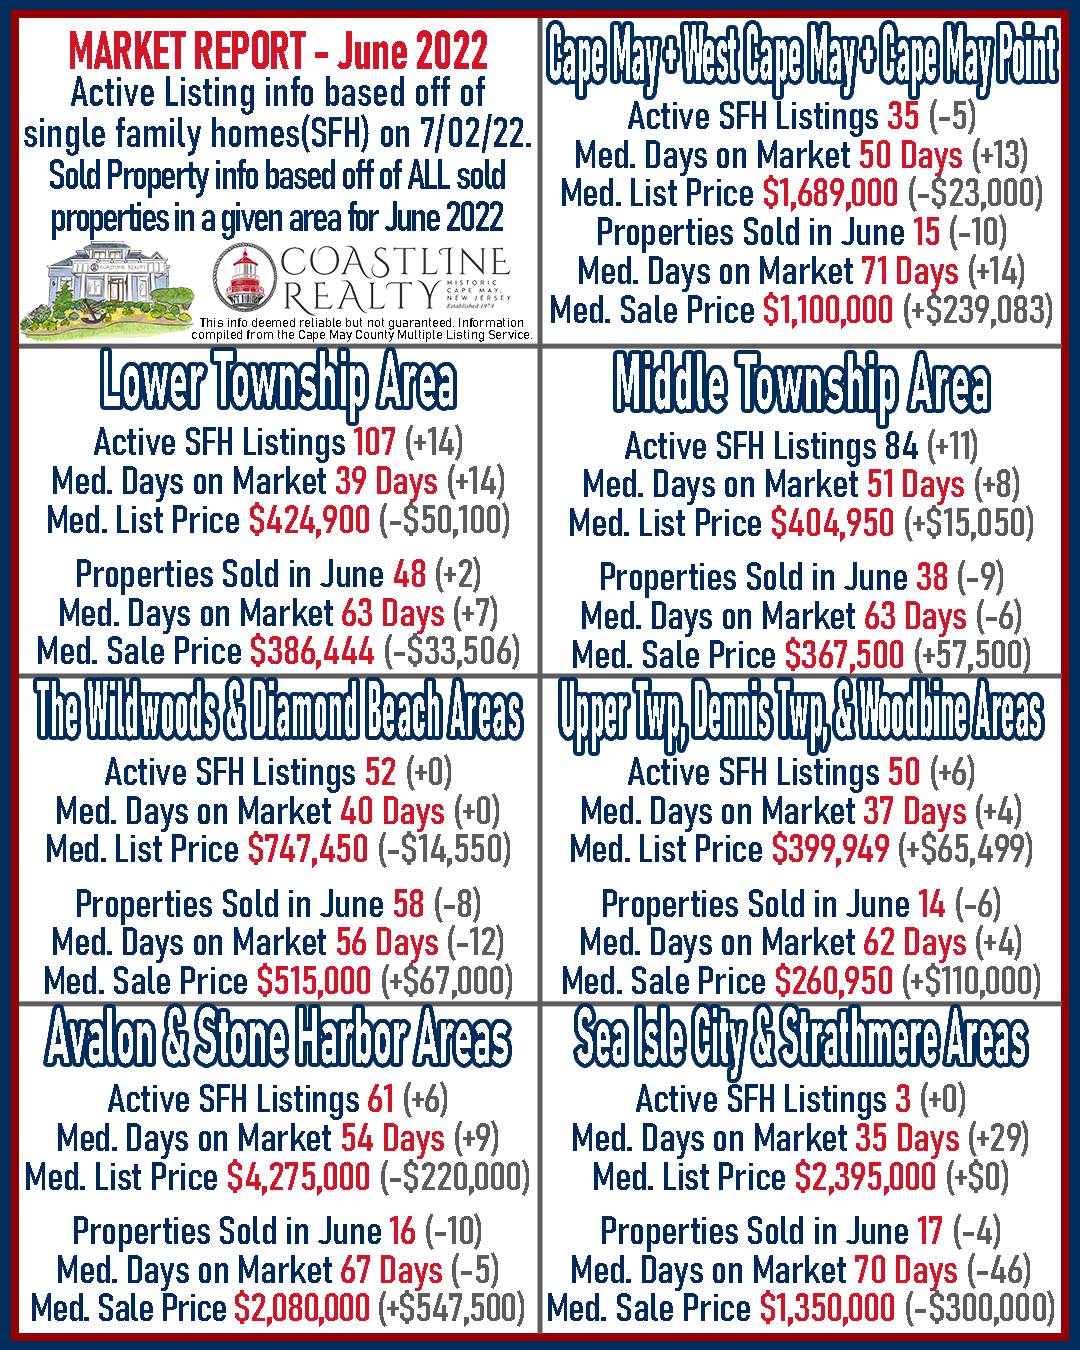
Looking across the entire county there isn’t a clear trend regarding active listings to begin July compared to the previous month and properties that sold during the month of June. Across the board there were small changes in both inventory, median list price, median sold price, and the volume of properties closing during the month.
Aside from the Cape May area every other area tracked in the above graphic did see either an increase in active properties or no change month-over-month.
Cape May Area (including Cape May City – West Cape May – Cape May Point)
Active SFH Listings as of 7/02/22 – 35 (-5 vs. last month)
Median Days on Market – 50 Days (+13 Days vs. last month)
Median List Price – $1,689,000 (-$23,000 vs. last month)
Sold Properties in June – 15 (-10 vs. last month)
Median Days on Market – 71 Days (+14 days vs. last month)
Median Sale Price – $1,100,000 (+$239,083 vs. last month)
Lower Township
Active SFH Listings as of 7/02/22 – 107 (+14 vs. last month)
Median Days on Market – 39 Days (+14 days vs. last month)
Median List Price – $424,900 (-$50,100 vs. last month)
Sold Properties in June – 48 (+2 vs. last month)
Median Days on Market – 63 Days (+7 days vs. last month)
Median Sale Price – $386,444 (-$33,506 vs. last month)
Middle Township
Active SFH Listings as of 7/02/22 – 84 (+11 vs. last month)
Median Days on Market – 51 Days (+8 days vs. last month)
Median List Price – $404,950 (+$15,050 vs last month)
Sold Properties in June – 38 (-9 vs. last month)
Median Days on Market – 63 Days (-6 days vs. last month)
Median Sale Price – $367,500 (+$57,500 vs. last month)
The Wildwoods & Diamond Beach
Active SFH Listings as of 7/02/22 – 52 (+0 vs. last month)
Median Days on Market – 40 Days (+0 Days vs. last month)
Median List Price – $747,450 (-$14,550 vs. last month)
Sold Properties in June – 58 (-8 vs. last month)
Median Days on Market – 56 Days (-12 days vs. last month)
Median Sale Price – $515,000 (-$67,000 vs. last month)
Dennis Township – Upper Township – Woodbine
Active SFH Listings as of 7/02/22 – 50 (+6 vs. last month)
Median Days on Market – 37 Days (+4 days vs. last month)
Median List Price – $399,949 (+$65,499 vs. last month)
Sold Properties in June – 14 (-6 vs. last month)
Median Days on Market – 62 Days (+4 days vs. last month)
Median Sale Price – $260,950 (+$110,000 vs. last month)
Avalon & Stone Harbor
Active SFH Listings as of 7/02/22 – 61 (+6 vs. last month)
Median Days on Market – 54 Days (+9 days vs. last month)
Median List Price – $4,275,000 (-$220,000 vs. last month)
Sold Properties in June – 16 (-10 vs. last month)
Median Days on Market – 67 Days (-5 days vs. last month)
Median Sale Price – $2,080,000 (+$547,500 vs. last month)
Sea Isle City & Strathmere
Active SFH Listings as of 7/02/22 – 3 (+0 vs. last month)
Median Days on Market – 35 Days (+29 days vs. last month)
Median List Price – $2,395,000 (+0 vs. last month)
Sold Properties in June – 17 (-4 vs. last month)
Median Days on Market – 70 Days (-46 days vs. last month)
Median Sale Price – $1,350,000 (-$300,000 vs. last month)
Are you looking to sell your property. Or are you curious about what it’s market value is? Give us a call at 609-884-5005 or inquire on our website. https://www.coastlinerealty.com/real-estate/selling-your-property
This info deemed reliable but not guaranteed. Information compiled from the Cape May County Multiple Listing Service.