Market Report! Here’s a quick Real Estate market report focusing on the City of Cape May, the Borough of West Cape May, and the Borough of Cape May Point. Included is a recap of all sold properties in the month of April 2021 for a given area; as well as a current look at the current inventory of residential single family homes(SFH) in an area as of May 1st, 2021.
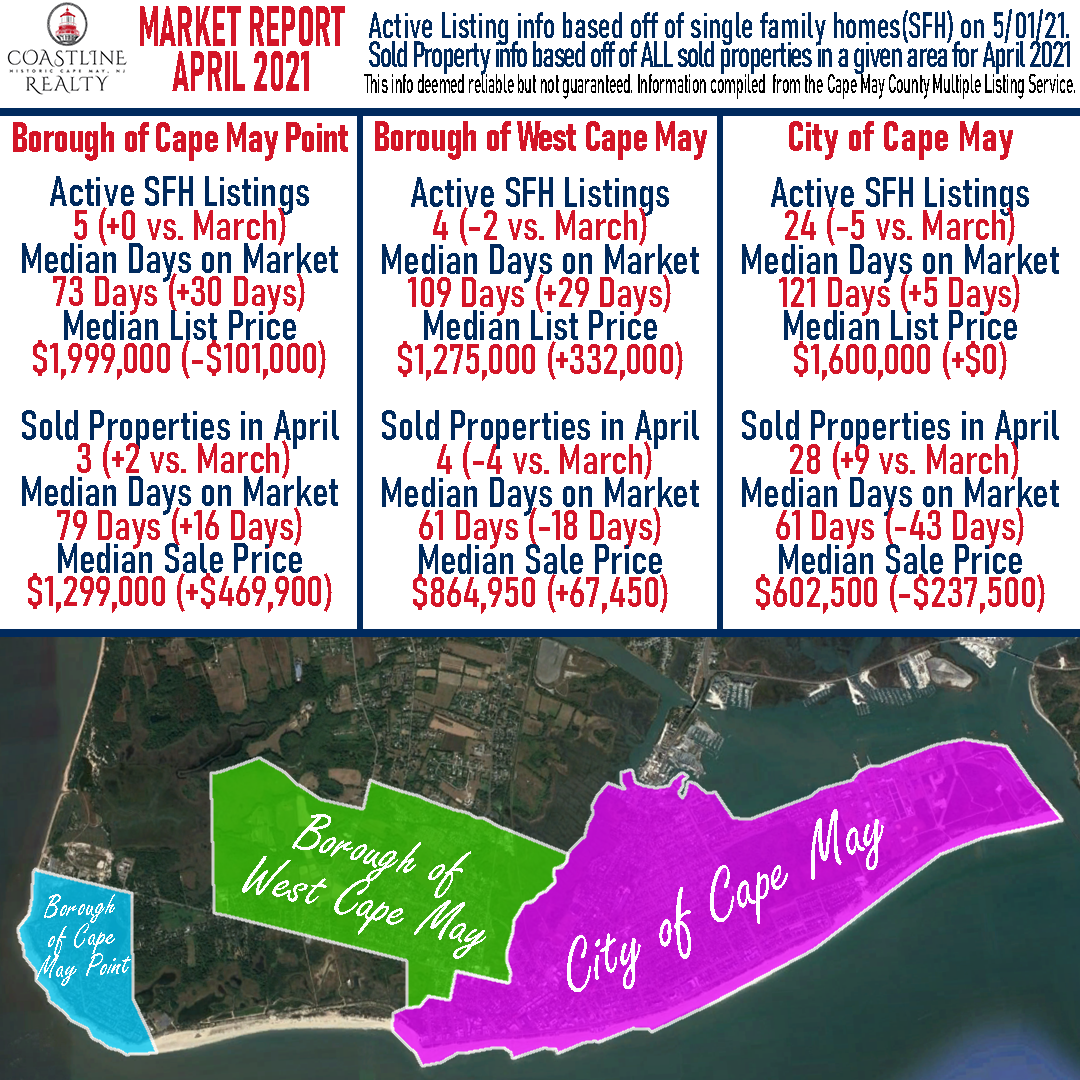
Cape May
Active SFH Listings as of 05/01/21– 24 (-5 vs. last month)
Median Days on Market – 121 Days (+5 days vs. last month)
Median List Price – $1,600,000 (+$0 vs. last month)
Sold Properties in April – 28 (+9 vs. last month)
Median Days on Market – 61 Days (-43 day vs. last month)
Median Sale Price – $602,500 (-$237,500 vs. last month)
West Cape May
Active SFH Listings as of 05/01/21– 4 (-2 vs. last month)
Median Days on Market – 109 Days (+29 days vs. last month)
Median List Price – $1,275,000 (+$332,000 vs. last month)
Sold Properties in April – 4 (-4 vs. last month)
Median Days on Market – 61 Days (-18 days vs. last month)
Median Sale Price – $864,950 (+67,450 vs. last month)
Cape May Point
Active SFH Listings as of 05/01/21– 5 (+0 vs. last month)
Median Days on Market – 73 Days (+30 vs. last month)
Median List Price – $1,999,000 (-$101,000 vs. last month)
Sold Properties in April – 3 (+2 vs. last month)
Median Days on Market – 79 Days (+16 Days vs. last month)
Median Sale Price – $1,299,900 (+$469,900 vs last month)
Are you looking to sell your property. Or are you curious about what it’s market value is? Give us a call at 609-884-5005 or inquire on our website. https://www.coastlinerealty.com/real-estate/selling-your-property
This info deemed reliable but not guaranteed. Information compiled from the Cape May County Multiple Listing Service.