Market Report! Here’s a quick Real Estate market report focusing on the City of Cape May, the Borough of West Cape May, and the Borough of Cape May Point. Included is a recap of all sold properties in the month of January 2021 2021 for a given area; as well as a current look at the current inventory of residential single family homes(SFH) in an area as of February 2nd, 2020.
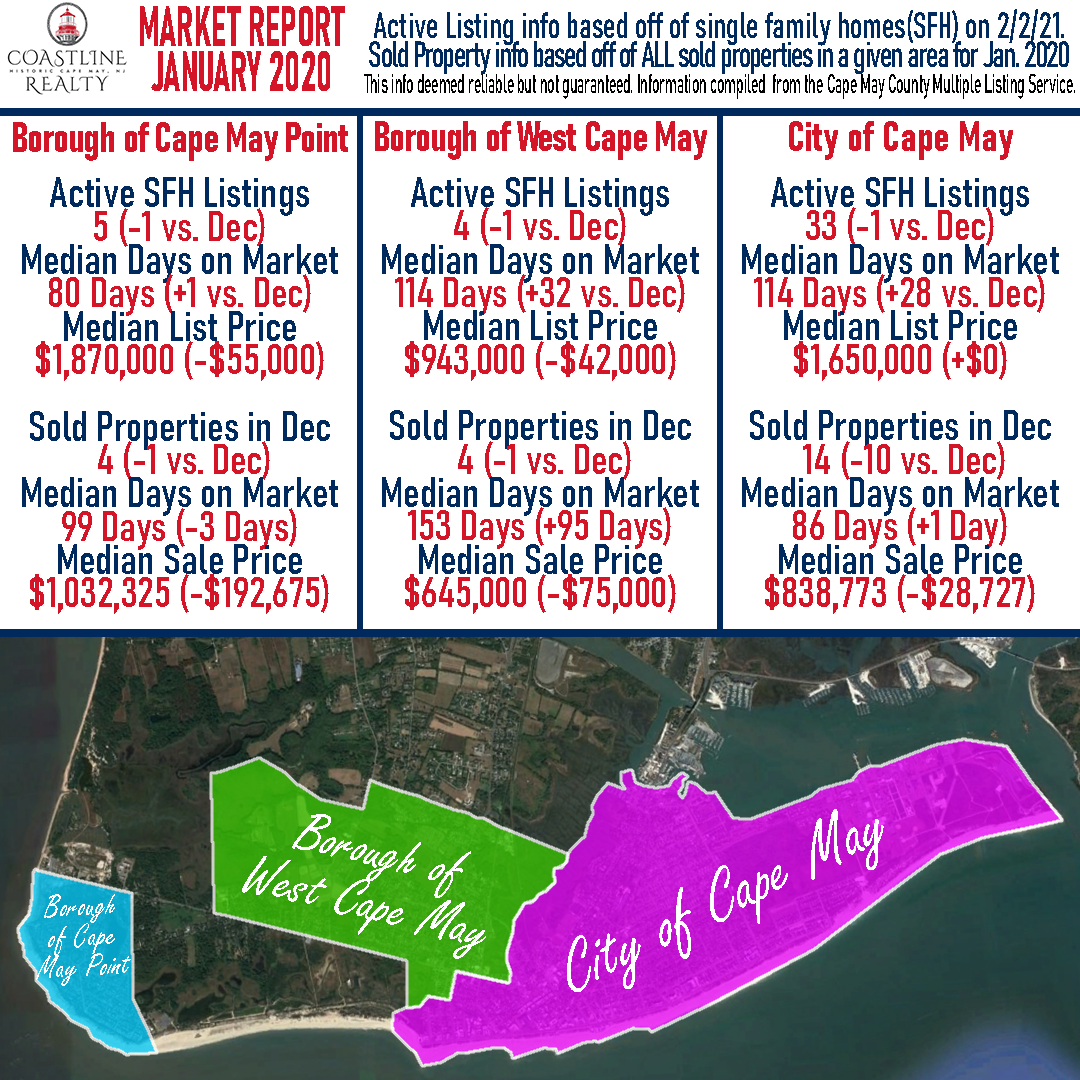
Cape May
Active SFH Listings as of 02/02/21– 33 (-1 vs. last month)
Median Days on Market – 114 Days (+28 days vs. last month)
Median List Price – $1,650,000 (+0 vs. last month)
Sold Properties in January – 14 (-10 vs. last month)
Median Days on Market – 86 Days (+1 days vs. last month)
Median Sale Price – $838,773 (-$28,727 vs. last month)
West Cape May
Active SFH Listings as of 02/02/21– 4 (-1 vs. last month)
Median Days on Market – 114 Days (+32 days vs. last month)
Median List Price – $943,000 (-$42,000 vs. last month)
Sold Properties in January – 4 (-1 vs. last month)
Median Days on Market – 153 Days (+95 days vs. last month)
Median Sale Price – $645,000 (-$75,000 vs. last month)
Cape May Point
Active SFH Listings as of 02/02/21– 5 (+1 vs. last month)
Median Days on Market – 80 Days (+1 vs. last month)
Median List Price – $1,870,000 (-55,000 vs. last month)
Sold Properties in January – 4 (-1 vs. last month)
Median Days on Market – 99 Days (-3 days vs. last month)
Median Sale Price – $1,032,325 (-$192,675 vs. last month)
Are you looking to sell your property. Or are you curious about what it’s market value is? Give us a call at 609-884-5005 or inquire on our website. https://www.coastlinerealty.com/real-estate/selling-your-property
This info deemed reliable but not guaranteed. Information compiled from the Cape May County Multiple Listing Service.