Here’s a quick Real Estate market report for Cape May, West Cape May, and Cape May Point for the month of August. Included is a recap of all sold properties(SFH, Land, Condo, etc) in the month of October 2021 for a given area; as well as a current look at the current inventory of residential single family homes(SFH) in an area as of November 5th 2021
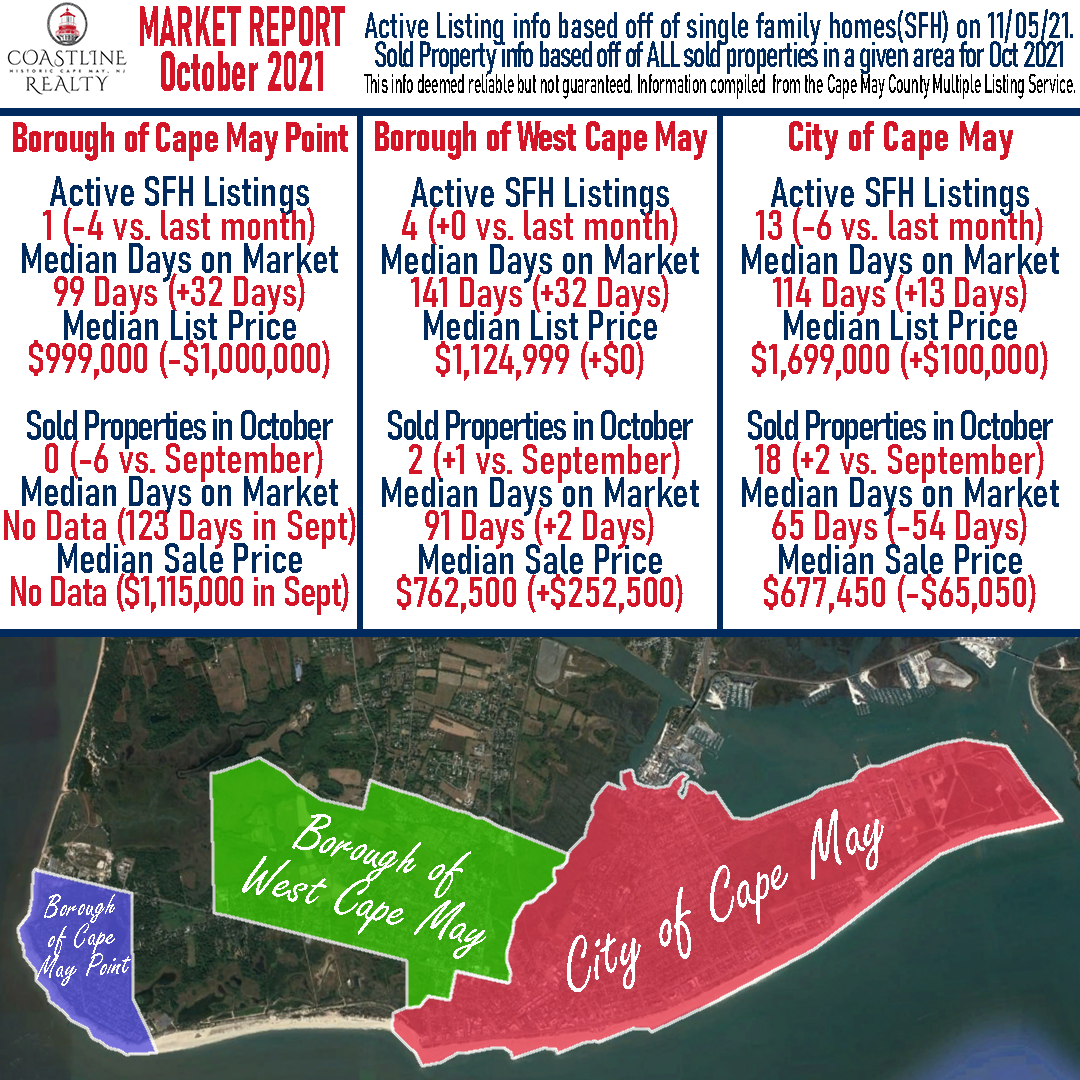
Cape May
Active SFH Listings as of 11/05/21– 13 (-6 vs. last month)
Median Days on Market – 114 Days (+13 days vs. last month)
Median List Price – $1,699,000 (+$100,000 vs. last month)
Sold Properties in October – 18 (+2 vs. last month)
Median Days on Market – 65 Days (-54 days vs. last month)
Median Sale Price – $677,450 (-$65,050 vs. last month)
West Cape May
Active SFH Listings as of 11/05/21– 4 (+0 vs. last month)
Median Days on Market – 141 Days (+32 days vs. last month)
Median List Price – $1,124,999 (+0 vs. last month)
Sold Properties in September – 2 (+1 vs. last month)
Median Days on Market – 91 Days (+2 days vs. last month)
Median Sale Price – $762,500 (+$252,500 vs. last month)
Cape May Point
Active SFH Listings as of 11/05/21– 1 (-4 vs. last month)
Median Days on Market – 99 Days (+32 days vs. last month)
Median List Price – $999,000 (-$1,000,000 vs. last month)
Sold Properties in October – 0 (-6 vs. last month)
Median Days on Market – No Data (123 Days last month)
Median Sale Price – No Data ($1,115,000 last month)
Are you looking to sell your property. Or are you curious about what it’s market value is? Give us a call at 609-884-5005 or inquire on our website. https://www.coastlinerealty.com/real-estate/selling-your-property
This info deemed reliable but not guaranteed. Information compiled from the Cape May County Multiple Listing Service.