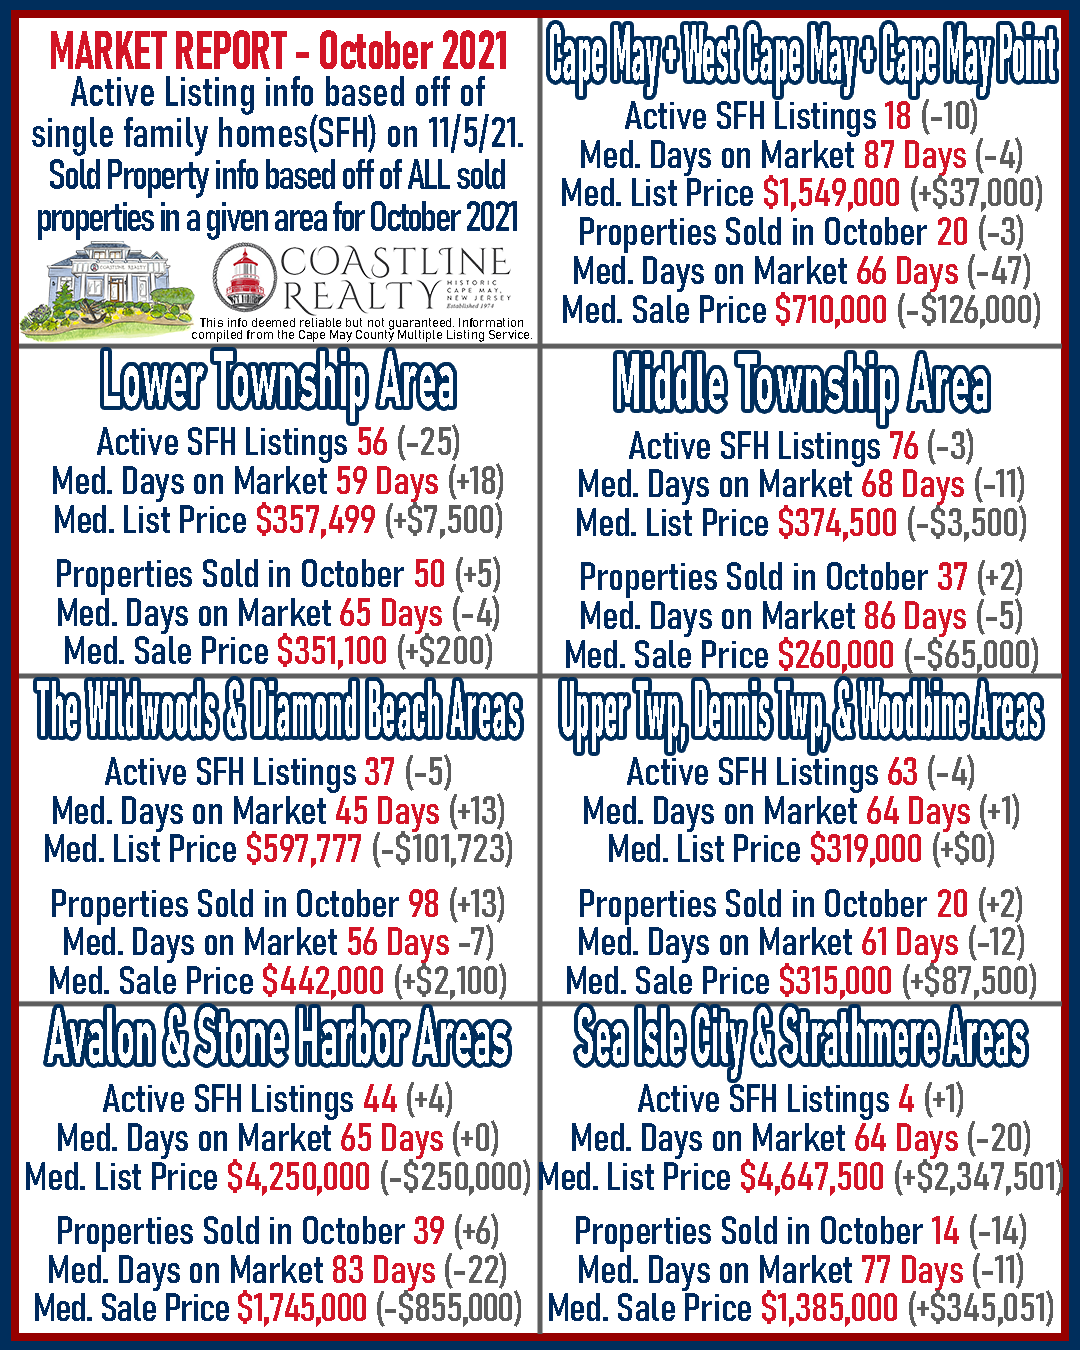
Market Report! Here’s a quick Real Estate market report of most of Cape May County. Included is a recap of all sold properties(SFH, Land, Condo, etc) in the month of November 2021 for a given area; as well as a current look at the current inventory of residential single family homes(SFH) in an area as of December 3rd, 2021.

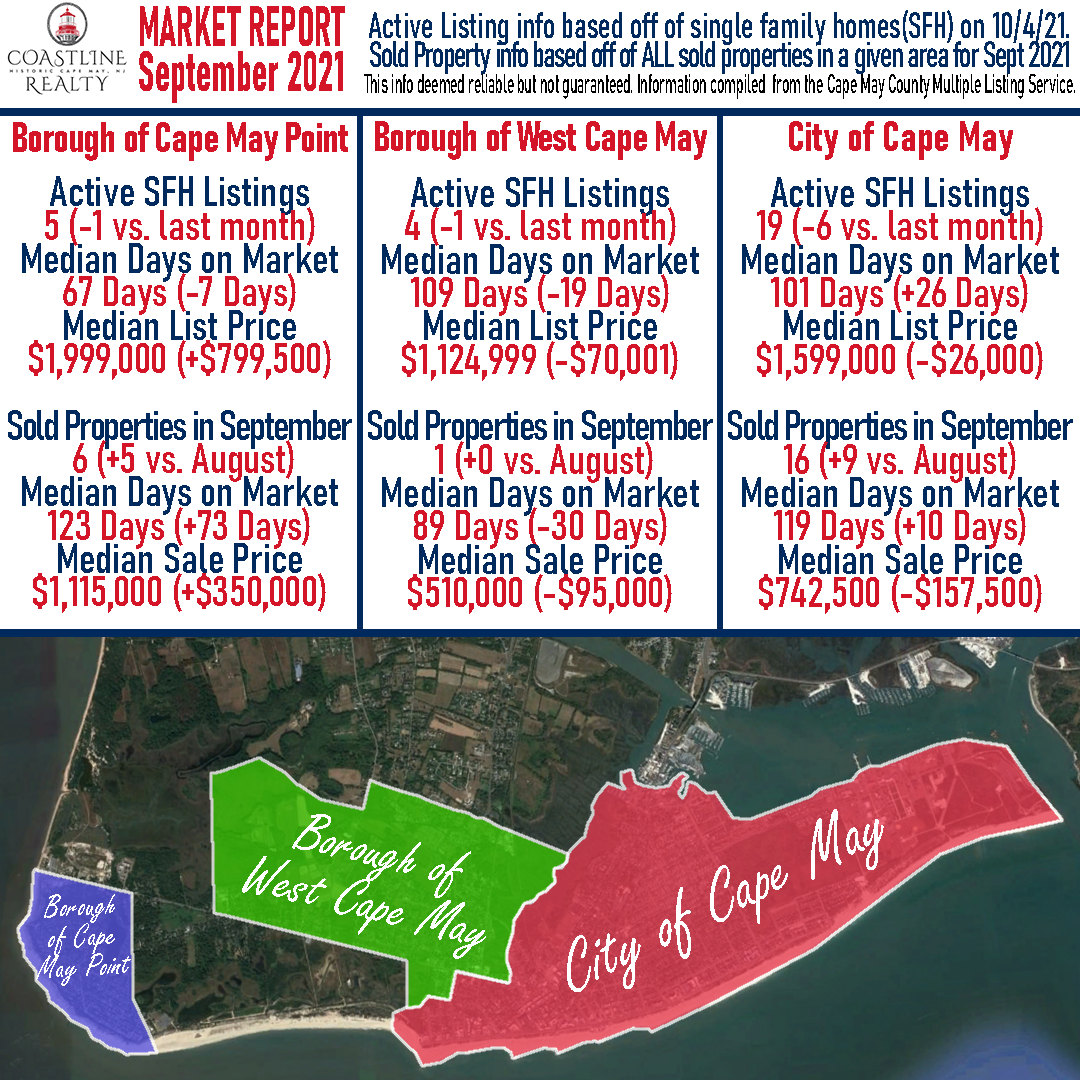
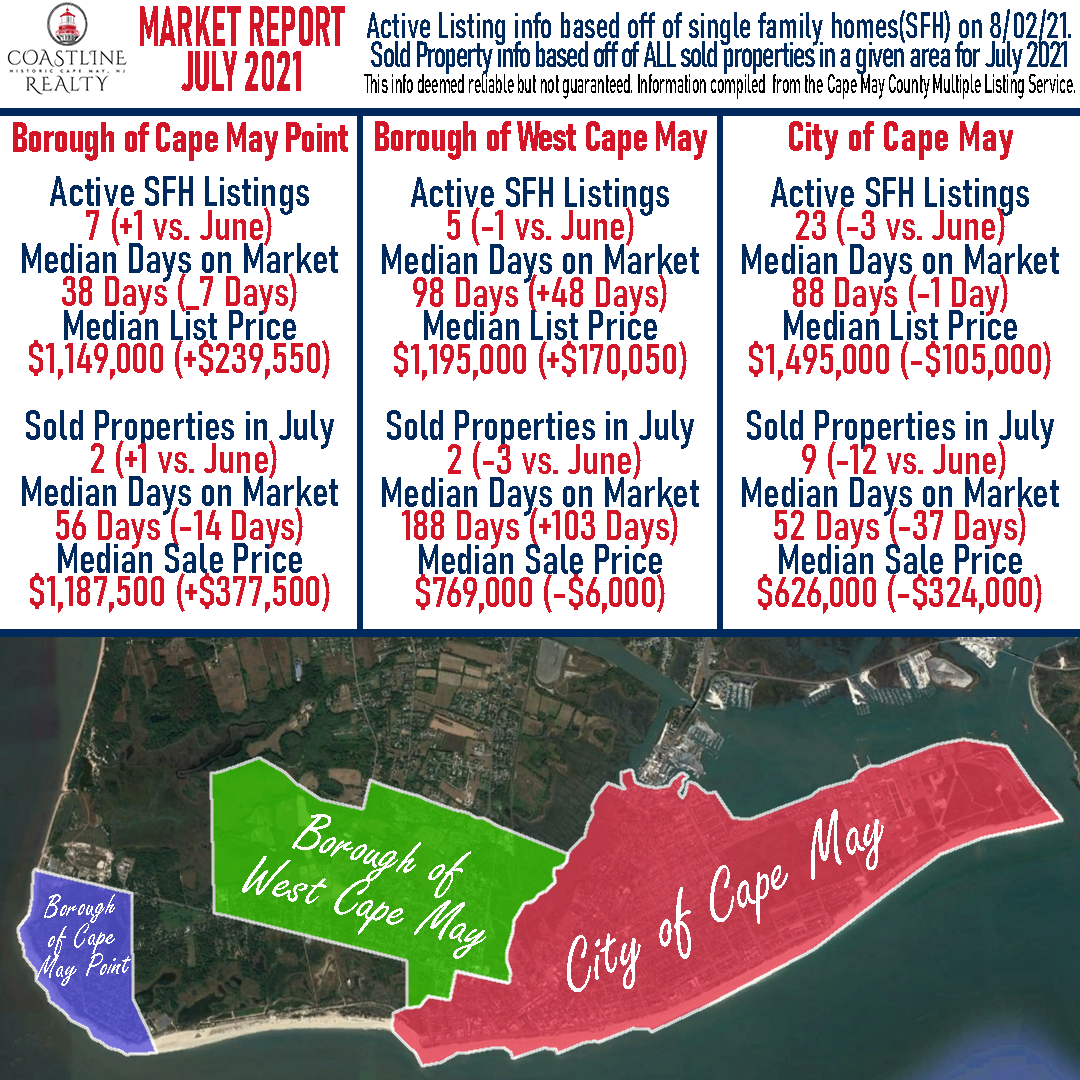
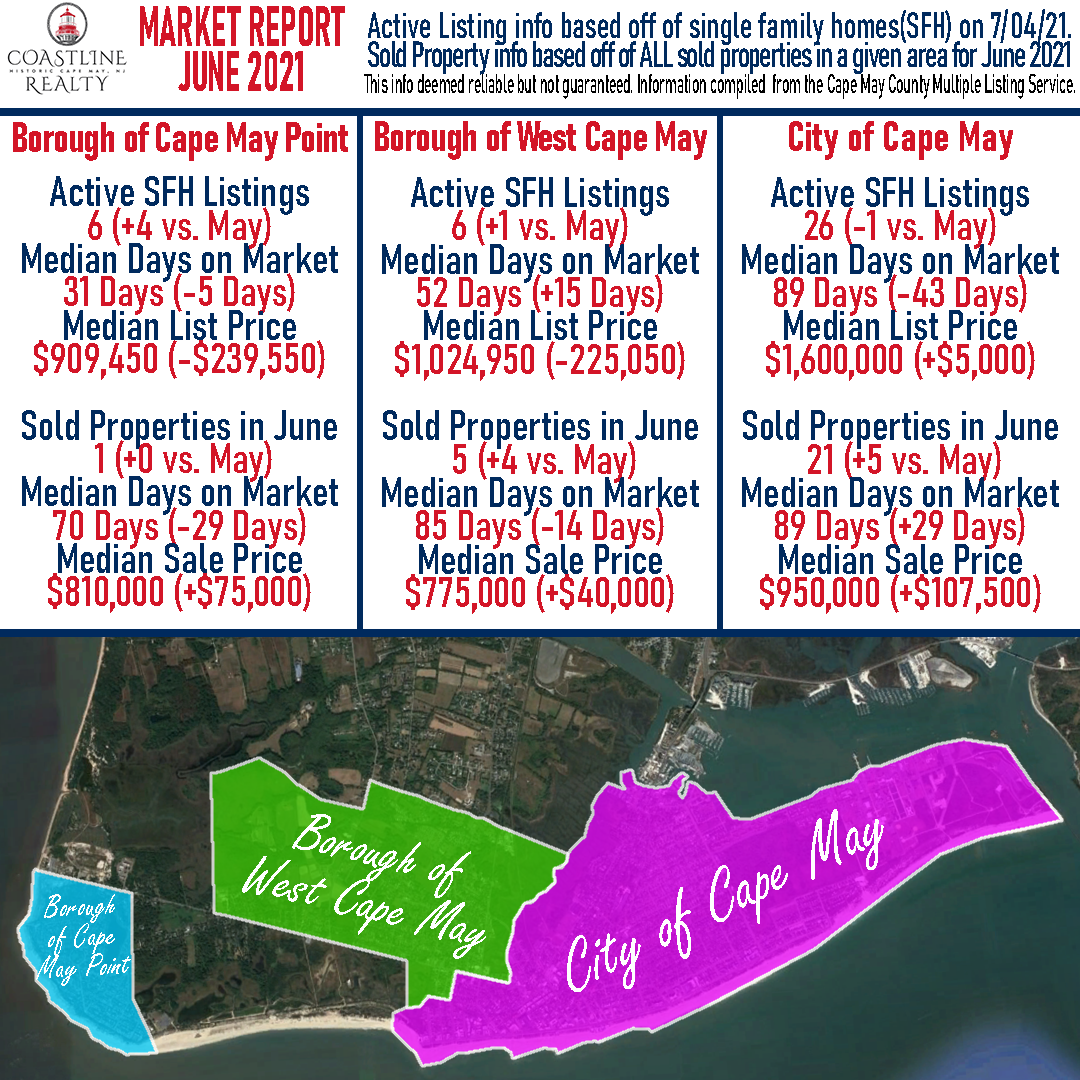
Cape May Area (including Cape May City – West Cape May – Cape May Point)
Active SFH Listings as of 12/03/21 – 18 (-0 vs. last month)
Median Days on Market – 85 Days (-2 Days vs. last month)
Median List Price – $1,724,000 (+$175,000 vs. last month)
Sold Properties in November – 25 (+5 vs. last month)
Median Days on Market – 113 Days (+47 days vs. last month)
Median Sale Price – $969,000 (+$259,000 vs. last month)
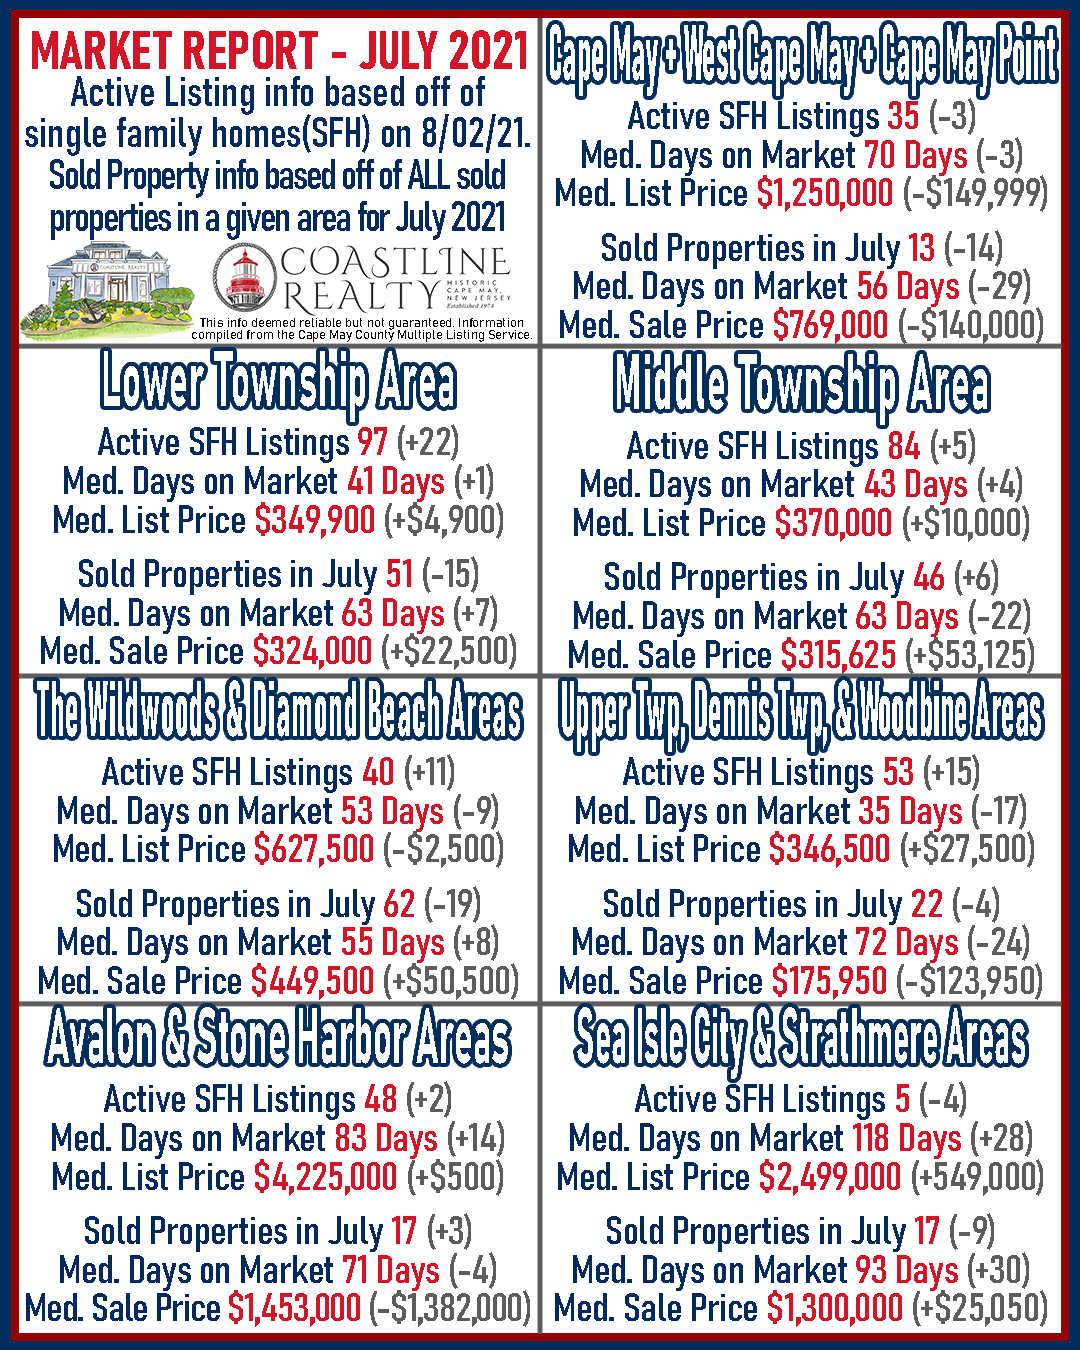
Lower Township
Active SFH Listings as of 12/03/21 – 60 (+4 vs. last month)
Median Days on Market – 66 Days (+7 days vs. last month)
Median List Price – $386,875 (+29,376 vs. last month)
Sold Properties in November – 59 (+9 vs. last month)
Median Days on Market – 66 Days (+1 day vs. last month)
Median Sale Price – $360,000 (+$9,900 vs. last month)
Middle Township
Active SFH Listings as of 12/03/21 – 73 (-3 vs. last month)
Median Days on Market – 93 Days (+25 days vs. last month)
Median List Price – $379,900 (+$5,400 vs last month)
Sold Properties in November – 24 (-13 vs. last month)
Median Days on Market – 70 Days (-16 days vs. last month)
Median Sale Price – $302,450 (+$42,450 vs. last month)
The Wildwoods & Diamond Beach
Active SFH Listings as of 12/03/21 – 36 (-1 vs. last month)
Median Days on Market – 71 Days (+26 Days vs. last month)
Median List Price – $549,450 (+$51,673 vs. last month)
Sold Properties in November – 81 (-17 vs. last month)
Median Days on Market – 74 Days (+18 days vs. last month)
Median Sale Price – $475,000 (+$33,000 vs. last month)
Dennis Township – Upper Township – Woodbine
Active SFH Listings as of 12/03/21 – 64 (-9 vs. last month)
Median Days on Market – 66 Days (+2 days vs. last month)
Median List Price – $364,450 (+$45,450 vs. last month)
Sold Properties in November – 26 (+6 vs. last month)
Median Days on Market – 76 Days (+15 days vs. last month)
Median Sale Price – $276,000 (-$39,000 vs. last month)
Avalon & Stone Harbor
Active SFH Listings as of 12/03/21 – 35 (-9 vs. last month)
Median Days on Market – 71 Days (+6 days vs. last month)
Median List Price – $3,895,000 (-$355,000 vs. last month)
Sold Properties in November – 38 (-1 vs. last month)
Median Days on Market – 93 Days (+10 days vs. last month)
Median Sale Price – $2,079,500 (+$334,500 vs. last month)
Sea Isle City & Strathmere
Active SFH Listings as of 12/03/21 – 4 (+0 vs. last month)
Median Days on Market – 92 Days (+28 days vs. last month)
Median List Price – $3,399,999 (-$1,247,501 vs. last month)
Sold Properties in November – 18 (+4 vs. last month)
Median Days on Market – 104 Days (+27 days vs. last month)
Median Sale Price – $1,450,000 (+$65,000 vs. last month)
Are you looking to sell your property. Or are you curious about what it’s market value is? Give us a call at 609-884-5005 or inquire on our website. https://www.coastlinerealty.com/real-estate/selling-your-property
This info deemed reliable but not guaranteed. Information compiled from the Cape May County Multiple Listing Service.