Market Report! Here’s a quick Real Estate market report of most of Cape May County. Included is a recap of all sold properties(SFH, Land, Condo, etc) in the month of February 2023 for a given area; as well as a current look at the current inventory of residential single family homes(SFH) in an area as of April 5th, 2023.
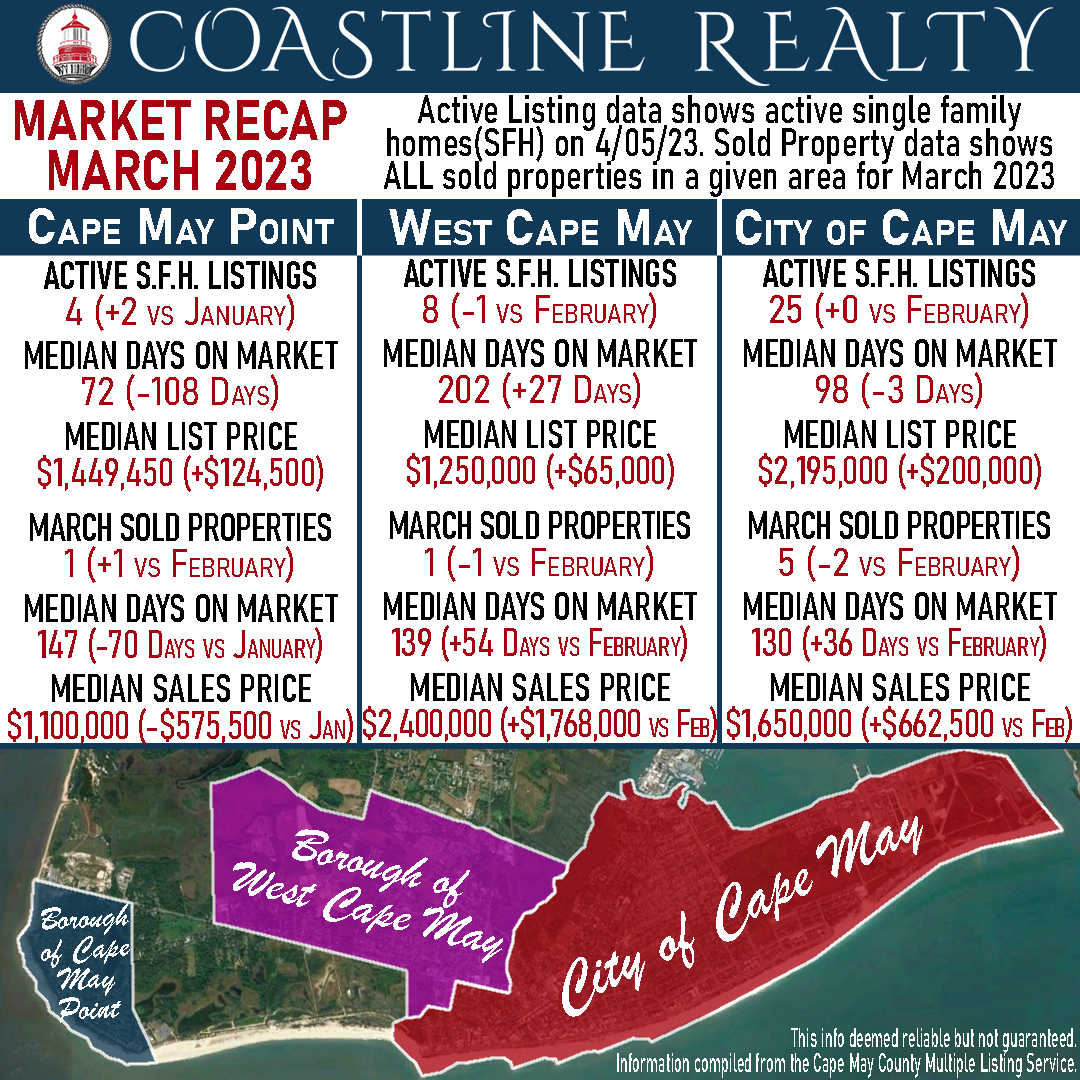
In the month of March the Cape May, West Cape May, and Cape May Point areas saw a small dip in properties that sold during the month, with a combined 7 between all three areas. The median sale price and days on market varied significantly month-to-month largely due to a small sample size.
Active listings on the market at the beginning of April saw a notable rise in median list prices compared to a month prior. The median days on market remains low for both the City of Cape May and Cape May Point, while West Cape May ticked higher to 202 days as of April 5th.
Cape May
Active SFH Listings as of 4/05/23 – 25 (+0 vs. last month)
Median Days on Market – 98 Days (-3 days vs. last month)
Median List Price – $2,195,000 (+$200,000 vs. last month)
Sold Properties in March – 5 (-2 vs. last month)
Median Days on Market – 130 Days (+36 days vs. last month)
Median Sale Price – $1,650,000 (+662,500 vs. last month)
West Cape May
Active SFH Listings as of 4/05/23 – 8 (-1 vs. last month)
Median Days on Market – 202 Days (+27 days vs. last month)
Median List Price – $1,250,000 (+$65,000 vs. last month)
Sold Properties in March – 1 (-1 vs. last month)
Median Days on Market – 139 Days (+54 days vs. last month)
Median Sale Price – $2,400,000 (+$1,768,000 vs. last month)
Cape May Point
Active SFH Listings as of 4/05/23 – 4 (+0 vs. last month)
Median Days on Market – 38 Days (-34 Days vs. last month)
Median List Price – $1,449,450 (+$0 vs. last month)
Sold Properties in March – 1 (+1 vs. last month)
Median Days on Market – 147 (-70 Days vs. January)
Median Sale Price – $1,100,000 (-$575,500 vs. January)
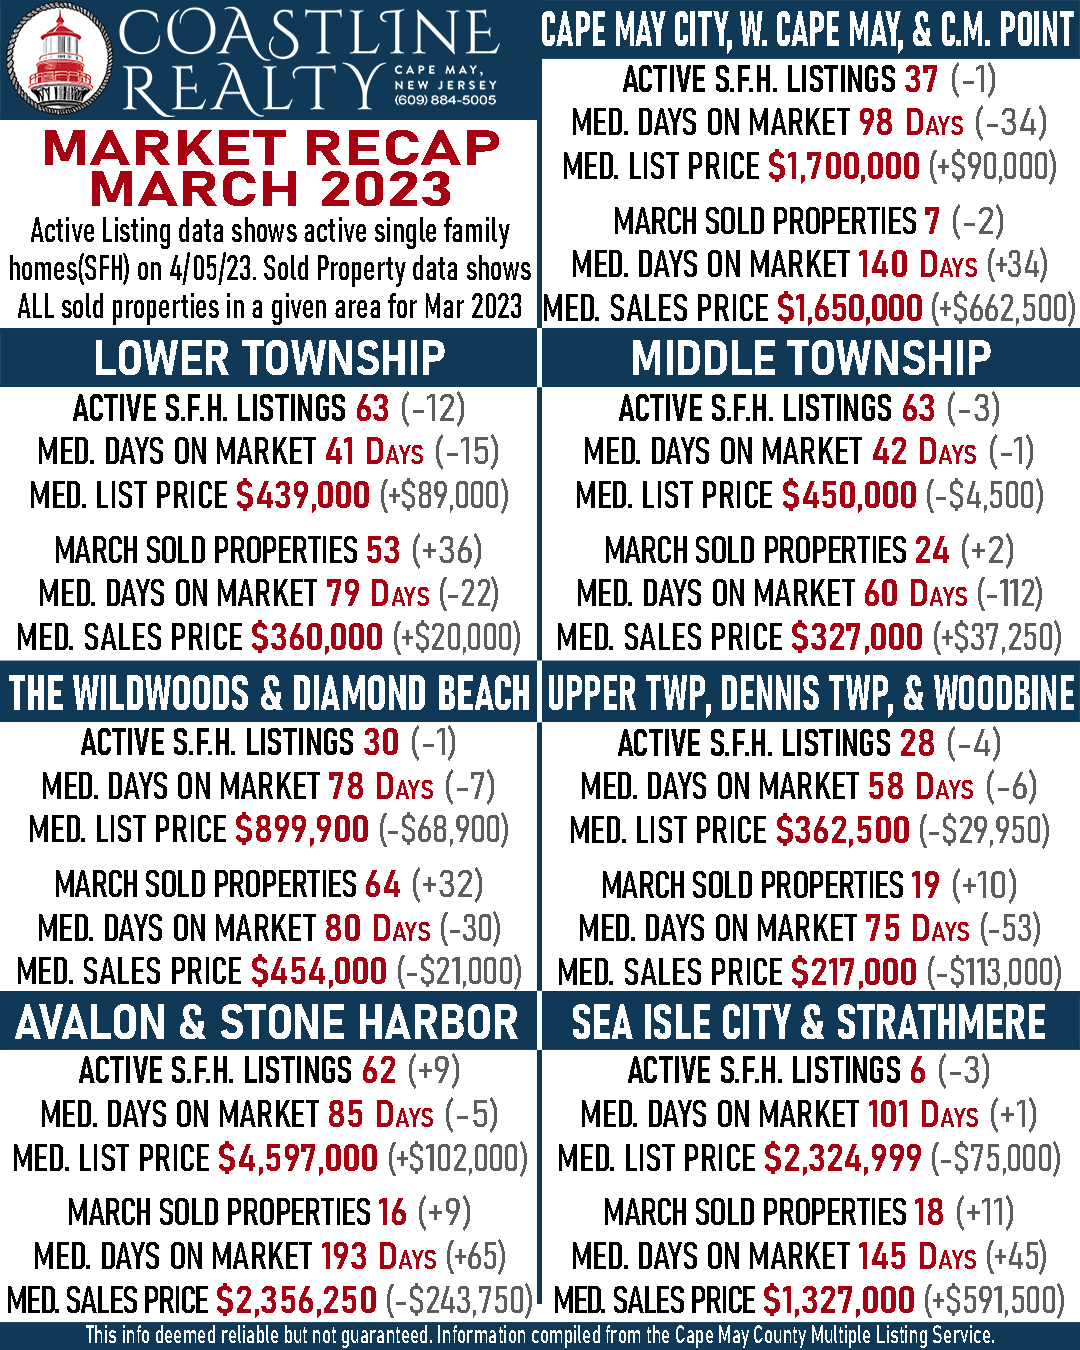
The trend across most of Cape May County to begin April was fewer available properties currently listed for sale. All but the Avalon/Stone Harbor areas saw active properties on the market drop compared to a month prior.
Most notably was Lower Township which saw a reduction of 12 properties largely influenced by the massive uptick in properties that sold in March. Both Lower Township and the Wildwoods saw a huge rise in sales during March and all areas aside from the immediate Cape May area saw a rise in sold properties during March.
Cape May Area (including Cape May City – West Cape May – Cape May Point)
Active SFH Listings as of 4/05/23 – 37 (-1 vs. last month)
Median Days on Market – 98 Days (-34 Days vs. last month)
Median List Price – $1,700,000 (+$90,000 vs. last month)
Sold Properties in March – 7 (-2 vs. last month)
Median Days on Market – 140 Days (+34 days vs. last month)
Median Sale Price – $1,650,000 (+$662,500 vs. last month)
Lower Township
Active SFH Listings as of 4/05/23 – 63 (-12 vs. last month)
Median Days on Market – 41 Days (-15 days vs. last month)
Median List Price – $439,000 (+$89,000 vs. last month)
Sold Properties in March – 53 (+36 vs. last month)
Median Days on Market – 79 Days (-22 days vs. last month)
Median Sale Price – $360,000 (+$20,000 vs. last month)
Middle Township
Active SFH Listings as of 4/05/23 – 63 (-3 vs. last month)
Median Days on Market – 42 Days (-1 day vs. last month)
Median List Price – $450,000 (-$4,500 vs last month)
Sold Properties in March – 24 (+2 vs. last month)
Median Days on Market – 60 Days (-112 days vs. last month)
Median Sale Price – $327,000 (+$37,250 vs. last month)
The Wildwoods & Diamond Beach
Active SFH Listings as of 4/05/23 – 30 (-1 vs. last month)
Median Days on Market – 78 Days (-7 Days vs. last month)
Median List Price – $899,900 (-$68,900 vs. last month)
Sold Properties in March – 64 (+32 vs. last month)
Median Days on Market – 80 Days (-30 days vs. last month)
Median Sale Price – $454,000 (-$21,000 vs. last month)
Dennis Township – Upper Township – Woodbine
Active SFH Listings as of 4/05/23 – 28 (-4 vs. last month)
Median Days on Market – 58 Days (-6 days vs. last month)
Median List Price – $362,500 (-$29,950 vs. last month)
Sold Properties in March – 19 (+10 vs. last month)
Median Days on Market – 75 Days (-53 days vs. last month)
Median Sale Price – $217,000 (-$113,000 vs. last month)
Avalon & Stone Harbor
Active SFH Listings as of 4/05/23 – 62 (+9 vs. last month)
Median Days on Market – 85 Days (-5 days vs. last month)
Median List Price – $4,597,000 (+$102,000 vs. last month)
Sold Properties in March – 16 (+9 vs. last month)
Median Days on Market – 193 Days (+65 days vs. last month)
Median Sale Price – $2,356,250 (-$243,750 vs. last month)
Sea Isle City & Strathmere
Active SFH Listings as of 4/05/23 – 6 (-3 vs. last month)
Median Days on Market – 101 Days (+1 day vs. last month)
Median List Price – $2,324,999 (-$75,000 vs. last month)
Sold Properties in March – 18 (+11 vs. last month)
Median Days on Market – 145 Days (+45 days vs. last month)
Median Sale Price – $1,327,000 (+591,500 vs. last month)
Are you looking to sell your property. Or are you curious about what it’s market value is? Give us a call at 609-884-5005 or inquire on our website. https://www.coastlinerealty.com/real-estate/selling-your-property
This info deemed reliable but not guaranteed. Information compiled from the Cape May County Multiple Listing Service.