Market Report! Here’s a quick Real Estate market report of most of Cape May County. Included is a recap of all sold properties(SFH, Land, Condo, etc) in the month of February 2023 for a given area; as well as a current look at the current inventory of residential single family homes(SFH) in an area as of March 1st, 2023.
The immediate Cape May area saw a slight decline in properties sold during February 2023. The median sale price for properties that did sell dropped compared to the previous two months. Historically February has been one of the area’s least active months, and to begin 2023, this trend remains in place.
At the start of March the area saw an uptick in active market properties compared to the prior month. Median list prices rose slightly, mainly due to low inventory and demand rising with the busy spring season right around the corner.
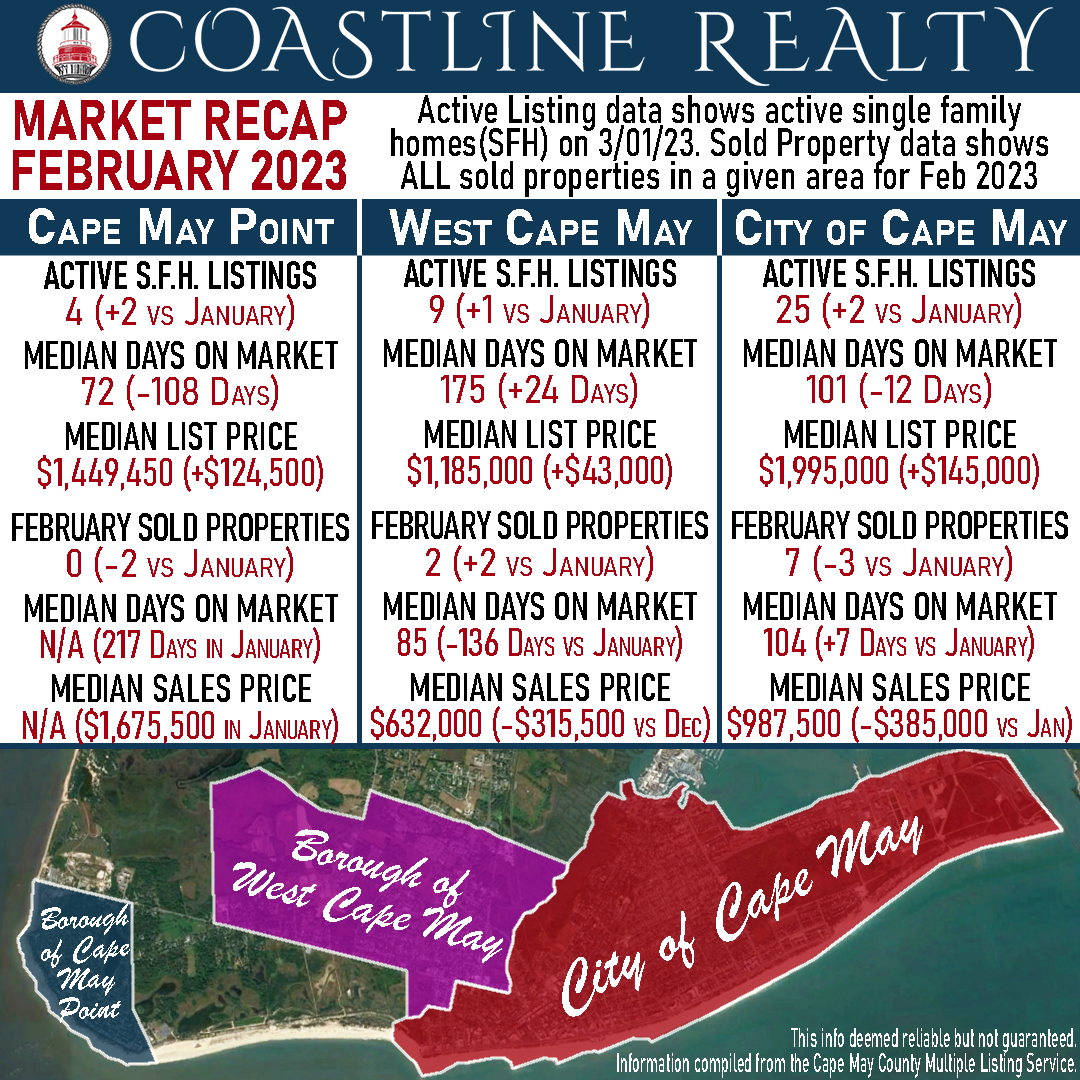
Cape May
Active SFH Listings as of 3/01/23 – 25 (+2 vs. last month)
Median Days on Market – 101 Days (-12 days vs. last month)
Median List Price – $1,995,000 (+145,000 vs. last month)
Sold Properties in February – 7 (-3 vs. last month)
Median Days on Market – 104 Days (+7 days vs. last month)
Median Sale Price – $987,500 (-$385,000 vs. last month)
West Cape May
Active SFH Listings as of 3/01/23 – 9 (+1 vs. last month)
Median Days on Market – 175 Days (+24 days vs. last month)
Median List Price – $1,185,000 (+43,000 vs. last month)
Sold Properties in February – 2 (+2 vs. last month)
Median Days on Market – 85 Days (-136 days vs. December)
Median Sale Price – $632,000 (-$315,500 vs. December)
Cape May Point
Active SFH Listings as of 3/01/23 – 4 (+2 vs. last month)
Median Days on Market – 72 Days (-108 Days vs. last month)
Median List Price – $1,449,450 (+$124,500 vs. last month)
Sold Properties in February – 0 (-2 vs. last month)
Median Days on Market – N/A (217 Days in January)
Median Sale Price – N/A ($1,675,500 in January)
The trend across Cape May County for February was that there wasn’t a clearly defined trend regarding activity and days on the market. The median sales price fell across each area. Most notable is Middle Township, which saw a drop of $180,250, primarily due to the large influx of vacant lots sold during the month.
To begin the month of March, the County saw most areas with lower Days on the Market compared to the month prior. Middle Township and Lower Township have extremely low D.O.M values beneath 60 days.
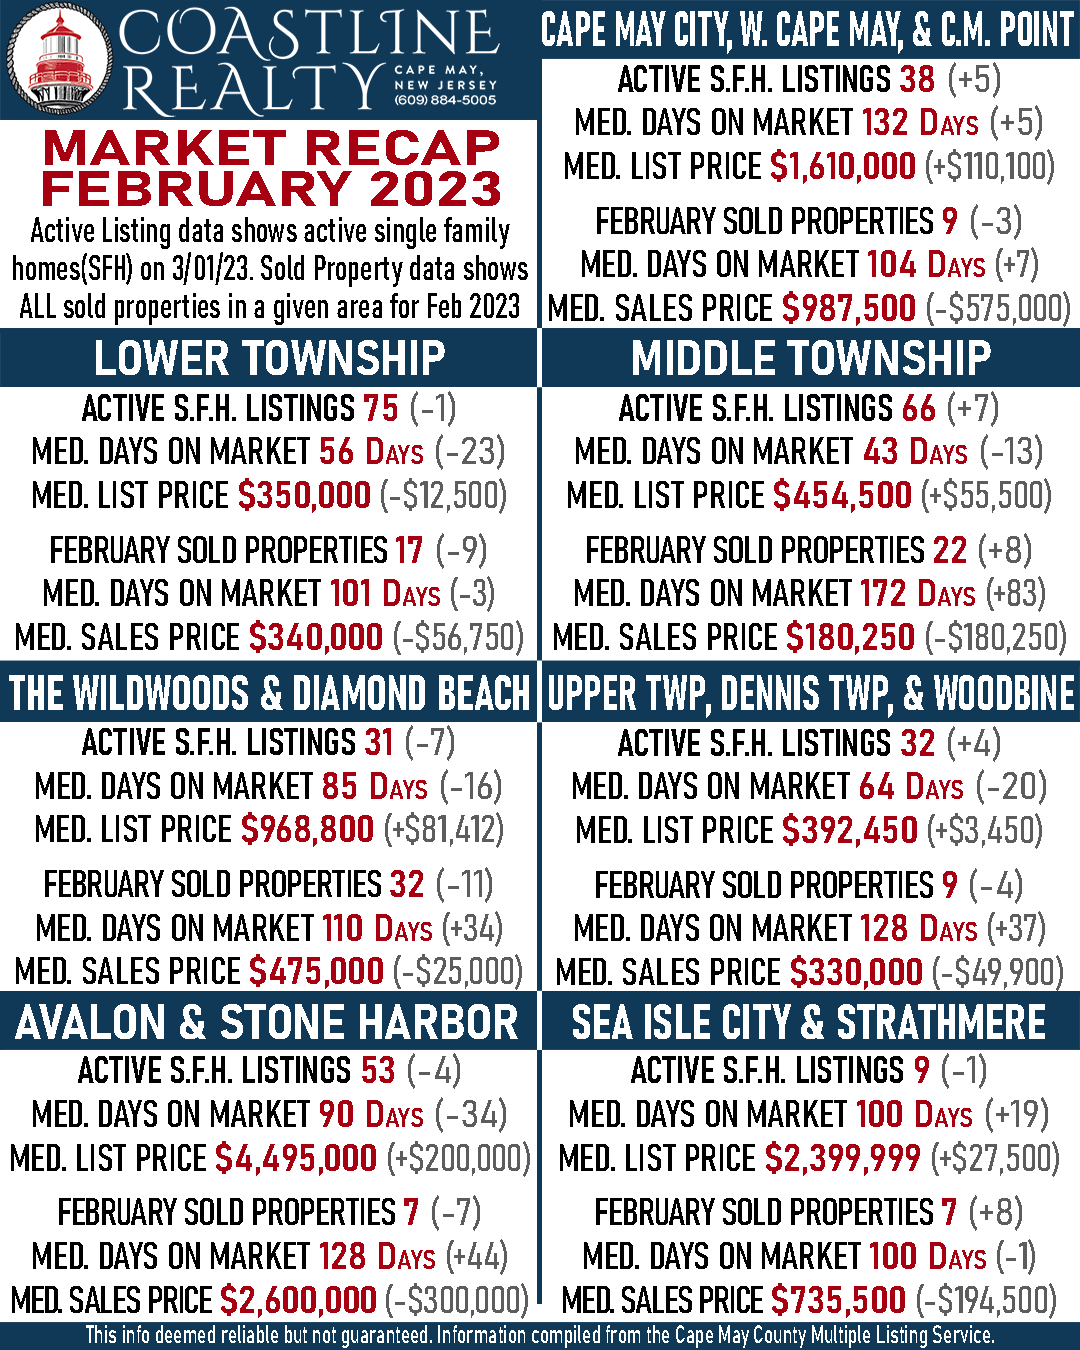
Cape May Area (including Cape May City – West Cape May – Cape May Point)
Active SFH Listings as of 3/01/23 – 38 (+5 vs. last month)
Median Days on Market – 132 Days (+5 Days vs. last month)
Median List Price – $1,610,000 (+$110,100 vs. last month)
Sold Properties in February – 9 (-3 vs. last month)
Median Days on Market – 104 Days (+7 days vs. last month)
Median Sale Price – $987,500 (-$575,000 vs. last month)
Lower Township
Active SFH Listings as of 3/01/23 – 75 (-1 vs. last month)
Median Days on Market – 56 Days (-23 days vs. last month)
Median List Price – $350,000 (-$12,500 vs. last month)
Sold Properties in February – 17 (-9 vs. last month)
Median Days on Market – 101 Days (-3 days vs. last month)
Median Sale Price – $340,000 (-$56,750 vs. last month)
Middle Township
Active SFH Listings as of 3/01/23 – 66 (+7 vs. last month)
Median Days on Market – 43 Days (-13 days vs. last month)
Median List Price – $454,500 (+$55,500 vs last month)
Sold Properties in February – 22 (+8 vs. last month)
Median Days on Market – 172 Days (+83 days vs. last month)
Median Sale Price – $289,750 (-$180,250 vs. last month)
The Wildwoods & Diamond Beach
Active SFH Listings as of 3/01/23 – 31 (-7 vs. last month)
Median Days on Market – 85 Days (-16 Days vs. last month)
Median List Price – $968,800 (+81,412 vs. last month)
Sold Properties in February – 32 (-11 vs. last month)
Median Days on Market – 110 Days (+34 days vs. last month)
Median Sale Price – $475,000 (-$25,000 vs. last month)
Dennis Township – Upper Township – Woodbine
Active SFH Listings as of 3/01/23 – 32 (+4 vs. last month)
Median Days on Market – 64 Days (-20 days vs. last month)
Median List Price – $392,450 (+3,450 vs. last month)
Sold Properties in February – 9 (-4 vs. last month)
Median Days on Market – 128 Days (+37 days vs. last month)
Median Sale Price – $330,000 (-$49,900 vs. last month)
Avalon & Stone Harbor
Active SFH Listings as of 3/01/23 – 53 (-4 vs. last month)
Median Days on Market – 90 Days (-34 days vs. last month)
Median List Price – $4,495,000 (+$200,000 vs. last month)
Sold Properties in February – 7 (-7 vs. last month)
Median Days on Market – 128 Days (+44 days vs. last month)
Median Sale Price – $2,600,000 (-$300,000 vs. last month)
Sea Isle City & Strathmere
Active SFH Listings as of 3/01/23 – 9 (-1 vs. last month)
Median Days on Market – 100 Days (+19 days vs. last month)
Median List Price – $2,399,999 (+$27,500 vs. last month)
Sold Properties in February – 7 (+8 vs. last month)
Median Days on Market – 100 Days (-1 day vs. last month)
Median Sale Price – $735,500 (-$194,500 vs. last month)
Are you looking to sell your property. Or are you curious about what it’s market value is? Give us a call at 609-884-5005 or inquire on our website. https://www.coastlinerealty.com/real-estate/selling-your-property
This info deemed reliable but not guaranteed. Information compiled from the Cape May County Multiple Listing Service.