Market Report! Here’s a quick Real Estate market report of most of Cape May County. Included is a recap of all sold properties in the month of December for a given area; as well as a current look at the current inventory of residential single family homes(SFH) in an area as of January 3rd 2020.
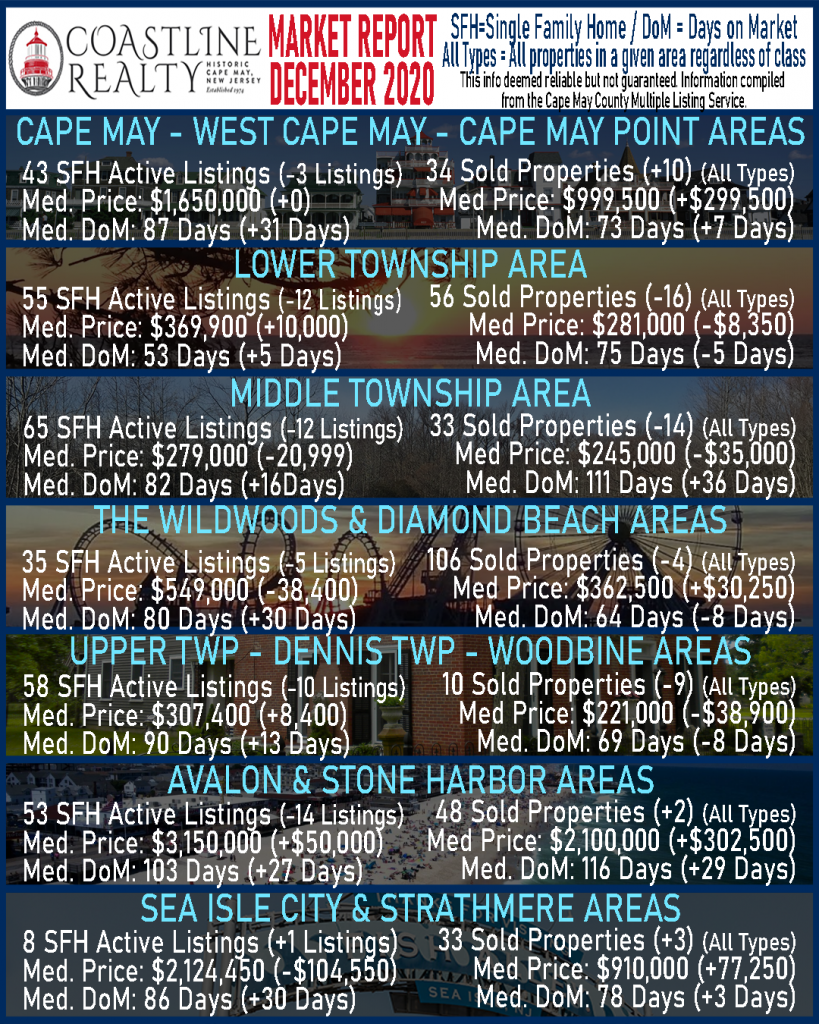
Cape May Area (including Cape May City – West Cape May – Cape May Point)
Active SFH Listings as of 01/03/21 – 43 (-3 vs. last month)
Median Days on Market – 87 Days (+31 Days vs. last month)
Median List Price – $1,650,000 (+0 vs. last month)
Sold Properties in December – 34 (+10 vs. last month)
Median Days on Market – 73 Days (+7 days vs. last month)
Median Sale Price – $999,500 (+$299,500 vs. last month)
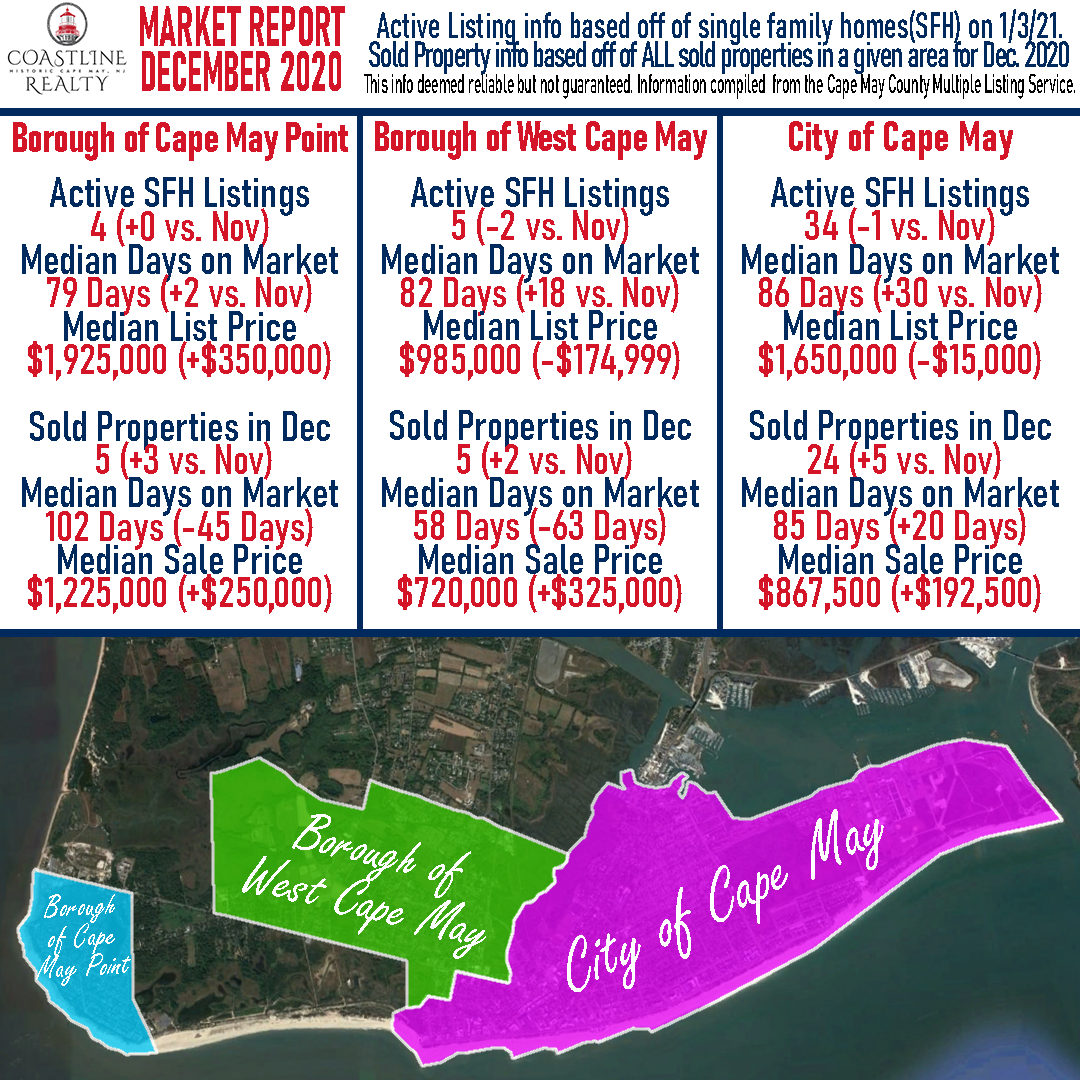
Cape May
Active SFH Listings as of 01/03/21– 34 (-1)
Median Days on Market – 86 Days (+30)
Median List Price – $1,650,000 (-15,000)
Sold Properties in December – 24 (+5 vs. last month)
Median Days on Market – 85 Days (+20 days vs. last month)
Median Sale Price – $867,500 (+$192,500 vs. last month)
West Cape May
Active SFH Listings as of 01/03/21– 5 (-2)
Median Days on Market – 82 Days (+18)
Median List Price – $985,000 (-174,999)
Sold Properties in December – 5 (+2 vs. last month)
Median Days on Market – 58 Days (-63 days vs. last month)
Median Sale Price – $720,000 (+$325,000 vs. last month)
Cape May Point
Active SFH Listings as of 01/03/21– 4 (+0)
Median Days on Market – 79 Days (+2)
Median List Price – $1,925,000 (+350,000)
Sold Properties in December – 5 (+3 vs. last month)
Median Days on Market – 102 Days (-45 days vs. last month)
Median Sale Price – $1,225,000 (+$250,000 vs. last month)
Lower Township
Active SFH Listings as of 01/03/21– 55 (-12 vs. last month)
Median Days on Market – 53 Days (+5 days vs. last month)
Median List Price – $369,900 (+10,000 vs. last month)
Sold Properties in December – 56 (-16 vs. last month)
Median Days on Market – 75 Days (-5 days vs. last month)
Median Sale Price – $281,000 (-$8,350 vs. last month)
Middle Township
Active SFH Listings as of 01/03/21 – 65 (-12 vs. last month)
Median Days on Market – 82 Days (+16 days vs. last month)
Median List Price – $279,000 (-$20,999 vs last month)
Sold Properties in December – 33 (-14 vs. last month)
Median Days on Market – 111 Days (+36 days vs. last month)
Median Sale Price – $245,000 (-$35,000 vs. last month)
The Wildwoods & Diamond Beach
Active SFH Listings as of 01/03/21 – 35 (-5 vs. last month)
Median Days on Market – 80 Days (+30 vs. last month)
Median List Price – $549,000 (-$38,400 vs. last month)
Sold Properties in December– 106 (-4 vs. last month)
Median Days on Market – 64 Days (-8 vs. last month)
Median Sale Price – $362,500(+$30,250 vs. last month)
Dennis Township – Upper Township – Woodbine
Active SFH Listings as of 01/03/21 – 58 (-10 vs. last month)
Median Days on Market – 90 Days (+13 days vs. last month)
Median List Price – $307,400 (+$8,400 vs. last month)
Sold Properties in December – 10 (-9 vs. last month)
Median Days on Market – 69 Days (-8 Days vs. last month)
Median Sale Price – $221,000 (-$38,900 vs. last month)
Avalon & Stone Harbor
Active SFH Listings as of 01/03/21 – 53 (-14 vs. last month)
Median Days on Market – 103 Days (+27 days vs. last month)
Median List Price – $3,150,000 (+$50,000 vs. last month)
Sold Properties in December – 48 (+2 vs. last month)
Median Days on Market – 116 Days (+29 days vs. last month)
Median Sale Price – $2,100,000 (+$302,500 vs. last month)
Sea Isle City & Strathmere
Active SFH Listings as of 01/03/21 – 8 (+1 vs. last month)
Median Days on Market – 86 Days (+30 days vs. last month)
Median List Price – $2,124,450 (-$104,550 vs. last month)
Sold Properties in December – 33 (+3 vs. last month)
Median Days on Market – 78 Days (+3 days vs. last month)
Median Sale Price – $910,000 (+$77,250 vs. last month)
Are you looking to sell your property. Or are you curious about what it’s market value is? Give us a call at 609-884-5005 or inquire on our website. https://www.coastlinerealty.com/real-estate/selling-your-property
This info deemed reliable but not guaranteed. Information compiled from the Cape May County Multiple Listing Service.