Market Report! Here’s a quick Real Estate market report of most of Cape May County. Included is a recap of all sold properties(SFH, Land, Condo, etc) in the month of January 2023 for a given area; as well as a current look at the current inventory of residential single family homes(SFH) in an area as of February 2nd, 2023.
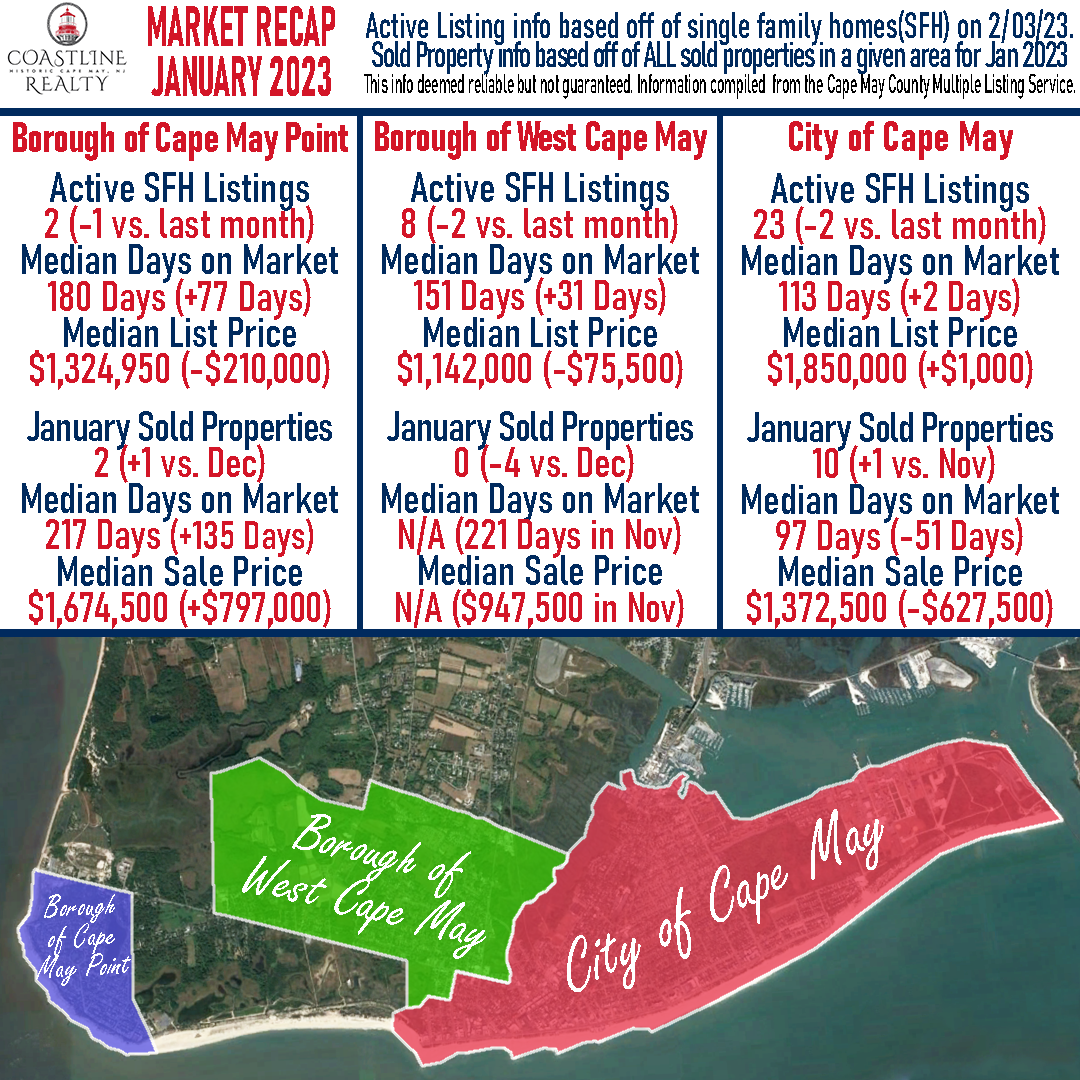
At the end of January, Cape May, West Cape May, and Cape May Point saw reductions in the currently availability of properties listed for sale. The median days on market rose across all three areas and besides a +$1,000 increase in median list price in Cape May, listing prices went down during January.
Properties that sold in January did not have a clear trend across the three areas. Cape May City saw 10 properties sell, one higher than December, and the median sale price / days on market were lower than the prior month. West Cape May had zero properties sell during January, four lower than in December. Cape May Point saw 2 properties close during the month and at a higher sale price and days on market when compared to December.
The trends aren’t too far off from last year during this quiet time of the year for real estate in the area. Compared to January 2022, the three areas have 33 total active listings in January 2023 compared to only 14 a year ago. For sold properties, this January there is a total of 12 sales while in January 2022 there was 24 sold properties.
Cape May
Active SFH Listings as of 02/02/2023– 23 (-2 vs. last month)
Median Days on Market – 113 Days (+2 days vs. last month)
Median List Price – $1,850,000 (+$1,000 vs. last month)
Sold Properties in January – 10 (+1 vs. last month)
Median Days on Market – 97 Days (-51 days vs. last month)
Median Sale Price – $1,372,500 (-$627,500 vs. last month)
West Cape May
Active SFH Listings as of 02/02/2023– 8 (-2 vs. last month)
Median Days on Market – 151 Days (+31 days vs. last month)
Median List Price – $1,142,000 (-$75,500 vs. last month)
Sold Properties in January – 0 (-4 vs. last month)
Median Days on Market – N/A Days (221 days in December)
Median Sale Price – N/A ($947,500 in December)
Cape May Point
Active SFH Listings as of 02/02/2023– 2 (-1 vs. last month)
Median Days on Market – 180 Days (+77 Days vs. last month)
Median List Price – $1,324,950 (-$210,000 vs. last month)
Sold Properties in January – 2 (+1 vs. last month)
Median Days on Market – 217 (+135 Days vs. last month)
Median Sale Price – $1,674,500 (+797,000 vs. last month)
Across the entire county there isn’t a constant trend to garner from active listings or sold properties during the month of January. Depending on the area/town/township you focus on you’ll find some have more activity for listings and some for sales. Given the small sample size and January (and soon to be February’s data) being a slow month the Cape May County real estate market trend is hard to pinpoint the direct it is heading going into the busy spring season.
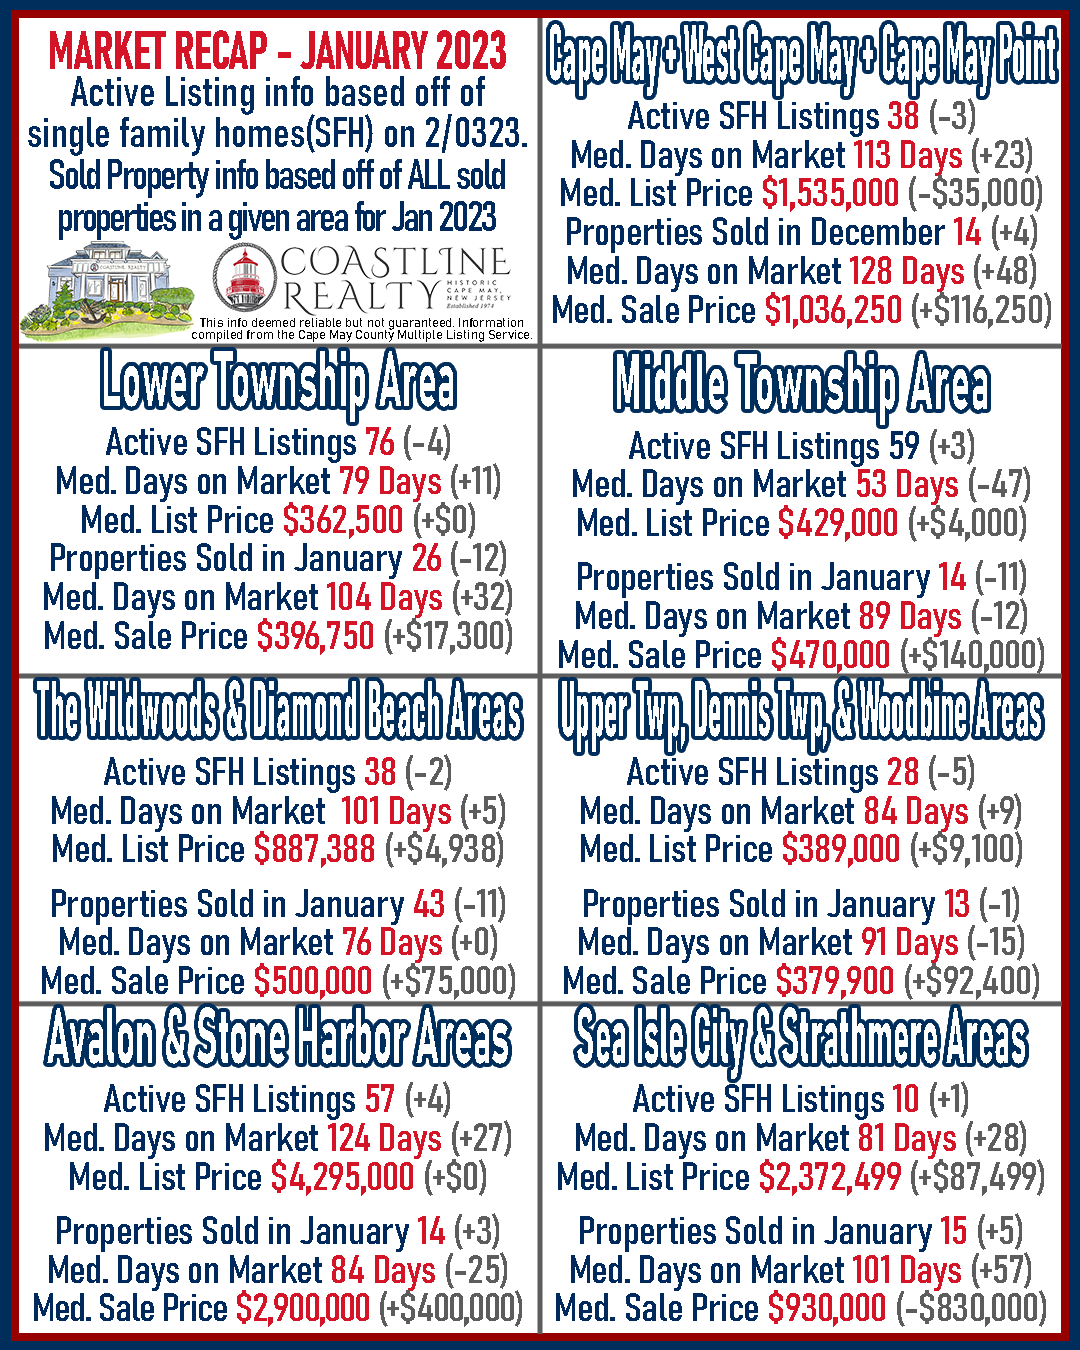
Cape May Area (including Cape May City – West Cape May – Cape May Point)
Active SFH Listings as of 02/02/2023– 33 (-5 vs. last month)
Median Days on Market – 127 Days (+14 Days vs. last month)
Median List Price – $1,499,900 (-$35,100 vs. last month)
Sold Properties in January – 12 (-2 vs. last month)
Median Days on Market – 97 Days (-31 days vs. last month)
Median Sale Price – $1,562,500 (+$1,562,500 vs. last month)
Lower Township
Active SFH Listings as of 02/02/2023– 76 (-4 vs. last month)
Median Days on Market – 79 Days (+11 days vs. last month)
Median List Price – $362,500 (-$12,500 vs. last month)
Sold Properties in January – 26 (-12 vs. last month)
Median Days on Market – 104 Days (+32 days vs. last month)
Median Sale Price – $396,750 (+$17,300 vs. last month)
Middle Township
Active SFH Listings as of 02/02/2023– 59 (+3 vs. last month)
Median Days on Market – 53 Days (-47 days vs. last month)
Median List Price – $429,000 (+$4,000 vs last month)
Sold Properties in January – 14 (-11 vs. last month)
Median Days on Market – 89 Days (-12 days vs. last month)
Median Sale Price – $470,000 (+$140,000 vs. last month)
The Wildwoods & Diamond Beach
Active SFH Listings as of 02/02/2023– 38 (-2 vs. last month)
Median Days on Market – 101 Days (+5 Days vs. last month)
Median List Price – $887,388 (+4,938 vs. last month)
Sold Properties in January – 43 (-11 vs. last month)
Median Days on Market – 76 Days (+0 days vs. last month)
Median Sale Price – $500,000 (+$75,000 vs. last month)
Dennis Township – Upper Township – Woodbine
Active SFH Listings as of 02/02/2023– 28 (-5 vs. last month)
Median Days on Market – 84 Days (+9 days vs. last month)
Median List Price – $389,000 (+$9,100 vs. last month)
Sold Properties in January – 13 (-1 vs. last month)
Median Days on Market – 91 Days (-15 days vs. last month)
Median Sale Price – $379,900 (+$92,400 vs. last month)
Avalon & Stone Harbor
Active SFH Listings as of 02/02/2023– 57 (+4 vs. last month)
Median Days on Market – 124 Days (+27 days vs. last month)
Median List Price – $4,295,000 (+$0 vs. last month)
Sold Properties in January – 14 (+3 vs. last month)
Median Days on Market – 84 Days (-25 days vs. last month)
Median Sale Price – $2,900,000 (+$400,000 vs. last month)
Sea Isle City & Strathmere
Active SFH Listings as of 02/02/2023– 10 (+1 vs. last month)
Median Days on Market – 81 Days (+28 days vs. last month)
Median List Price – $2,372,499 (+$87,499 vs. last month)
Sold Properties in January – 15 (+5 vs. last month)
Median Days on Market – 101 Days (-57 days vs. last month)
Median Sale Price – $930,000 (-$830,000 vs. last month)
Are you looking to sell your property. Or are you curious about what it’s market value is? Give us a call at 609-884-5005 or inquire on our website. https://www.coastlinerealty.com/real-estate/selling-your-property
This info deemed reliable but not guaranteed. Information compiled from the Cape May County Multiple Listing Service.