Market Report! Here’s a quick Real Estate market report of most of Cape May County. Included is a recap of all sold properties(SFH, Land, Condo, etc) in the month of May 2022 for a given area; as well as a current look at the current inventory of residential single family homes(SFH) in an area as of June 3rd, 2022
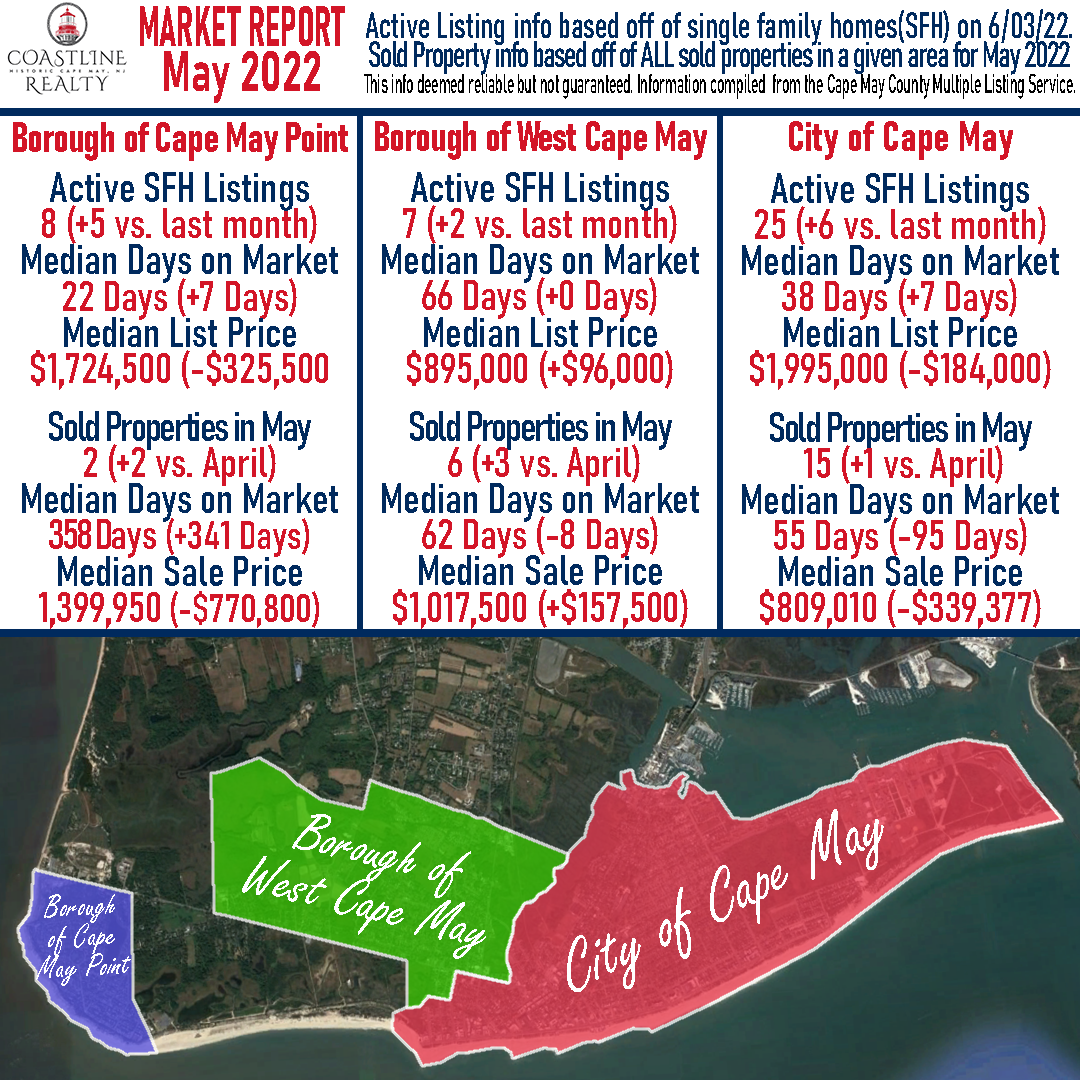
Across Cape May, West Cape May, and Cape May Point each area saw a rise in the total number of active listings to start June 2022. The number of properties that sold during the month of May also rose in all three areas. Overall the current days-on-market value for active listings remains at historic lows.
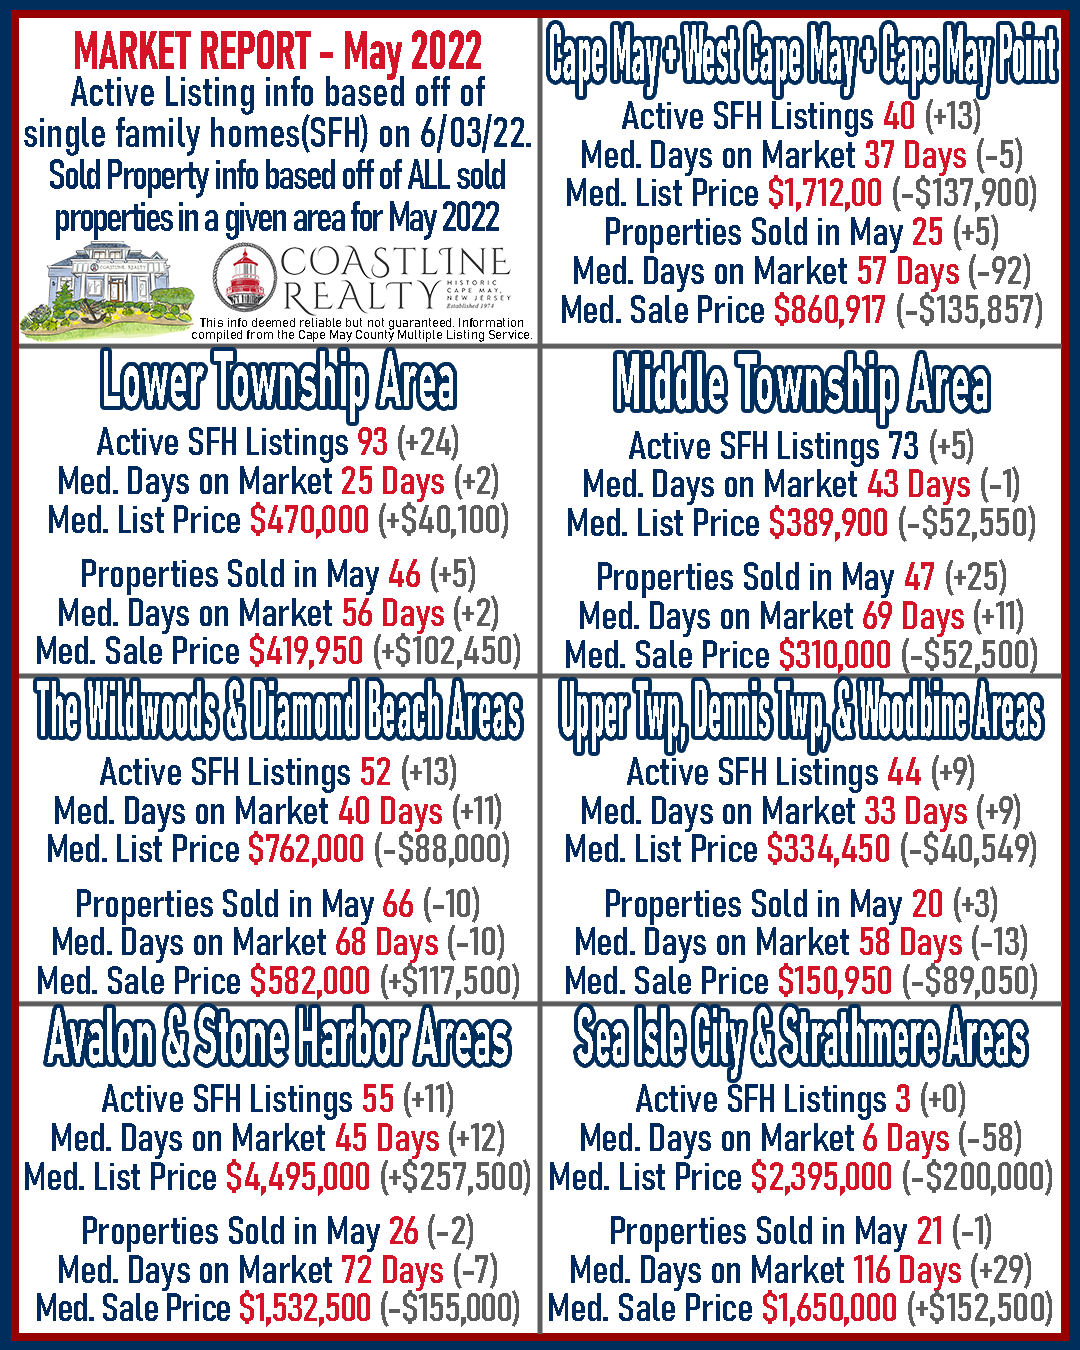
Looking at the entire county, the trend of active listings being more plentiful compared to previous months holds true for across the county. Asking prices to start June fluctuate slightly depending on the specific area, but remain comparable to earlier in 2022. Sold properties for the month of May trend much higher in and close to Cape May while Wildwood up through Avalon saw a dip in the number of properties that sold during May.
Cape May Area (including Cape May City – West Cape May – Cape May Point)
Active SFH Listings as of 6/03/22 – 40 (+13 vs. last month)
Median Days on Market – 37 Days (-5 Days vs. last month)
Median List Price – $1,712,000 (-$137,900 vs. last month)
Sold Properties in May – 25 (+5 vs. last month)
Median Days on Market – 57 Days (-92 days vs. last month)
Median Sale Price – $860,917 (-$135,857 vs. last month)
Cape May
Active SFH Listings as of 6/03/22 – 25 (+6 vs. last month)
Median Days on Market – 38 Days (+7 days vs. last month)
Median List Price – $1,995,000 (-$184,000 vs. last month)
Sold Properties in May – 15 (+1 vs. last month)
Median Days on Market – 55 Days (-95 days vs. last month)
Median Sale Price – $809,010 (-$339,377 vs. last month)
West Cape May
Active SFH Listings as of 6/03/22 –7 (+2 vs. last month)
Median Days on Market – 66 Days (+0 days vs. last month)
Median List Price – $895,000 (+$96,000 vs. last month)
Sold Properties in May – 6 (+3 vs. last month)
Median Days on Market – 62 Days (-8 days vs. last month)
Median Sale Price – $1,017,500 (+$157,500 vs. last month)
Cape May Point
Active SFH Listings as of 6/03/22 – 8 (+5 vs. last month)
Median Days on Market – 22 Days (+7 Days vs. last month)
Median List Price – $1,724,500 (-$325,500 vs. last month)
Sold Properties in May – 2 (+2 vs. last month)
Median Days on Market – 358 Days (+341 Days vs. March)
Median Sale Price – $1,399,950 (-$770,800 vs. March)
Lower Township
Active SFH Listings as of 6/03/22 – 93 (+24 vs. last month)
Median Days on Market – 25 Days (+2 days vs. last month)
Median List Price – $470,000 (+$40,100 vs. last month)
Sold Properties in May – 46 (+5 vs. last month)
Median Days on Market – 56 Days (+2 days vs. last month)
Median Sale Price – $419,950 (+$102,450 vs. last month)
Middle Township
Active SFH Listings as of 6/03/22 – 73 (+5 vs. last month)
Median Days on Market – 43 Days (-1 days vs. last month)
Median List Price – $389,900 (-$52,550 vs last month)
Sold Properties in May – 47 (+25 vs. last month)
Median Days on Market – 69 Days (+11 days vs. last month)
Median Sale Price – $310,000 (-$52,500 vs. last month)
The Wildwoods & Diamond Beach
Active SFH Listings as of 6/03/22 – 52 (+13 vs. last month)
Median Days on Market – 40 Days (+11 Days vs. last month)
Median List Price – $762,000 (-$88,000 vs. last month)
Sold Properties in May – 66 (-10 vs. last month)
Median Days on Market – 68 Days (-10 days vs. last month)
Median Sale Price – $582,000 (+$117,500 vs. last month)
Dennis Township – Upper Township – Woodbine
Active SFH Listings as of 6/03/22 – 44 (+9 vs. last month)
Median Days on Market – 33 Days (+9 days vs. last month)
Median List Price – $334,450 (-$40,549 vs. last month)
Sold Properties in May – 20 (+3 vs. last month)
Median Days on Market – 58 Days (-13 days vs. last month)
Median Sale Price – $150,950 (-$89,050 vs. last month)
Avalon & Stone Harbor
Active SFH Listings as of 6/03/22 – 55 (+11 vs. last month)
Median Days on Market – 45 Days (+12 days vs. last month)
Median List Price – $4,495,000 (+$257,500 vs. last month)
Sold Properties in May – 26 (-2 vs. last month)
Median Days on Market – 72 Days (-7 days vs. last month)
Median Sale Price – $1,532,500 (-$155,000 vs. last month)
Sea Isle City & Strathmere
Active SFH Listings as of 6/03/22 – 3 (+0 vs. last month)
Median Days on Market – 6 Days (-58 days vs. last month)
Median List Price – $2,395,000 (-$200,000 vs. last month)
Sold Properties in May – 21 (-1 vs. last month)
Median Days on Market – 116 Days (+29 days vs. last month)
Median Sale Price – $1,650,000 (+$152,500 vs. last month)
Are you looking to sell your property. Or are you curious about what it’s market value is? Give us a call at 609-884-5005 or inquire on our website. https://www.coastlinerealty.com/real-estate/selling-your-property
This info deemed reliable but not guaranteed. Information compiled from the Cape May County Multiple Listing Service.