Market Report! Here’s a quick Real Estate market report of most of Cape May County. Included is a recap of all sold properties(SFH, Land, Condo, etc) in the month of November 2022 for a given area; as well as a current look at the current inventory of residential single family homes(SFH) in an area as of December 1st, 2022.
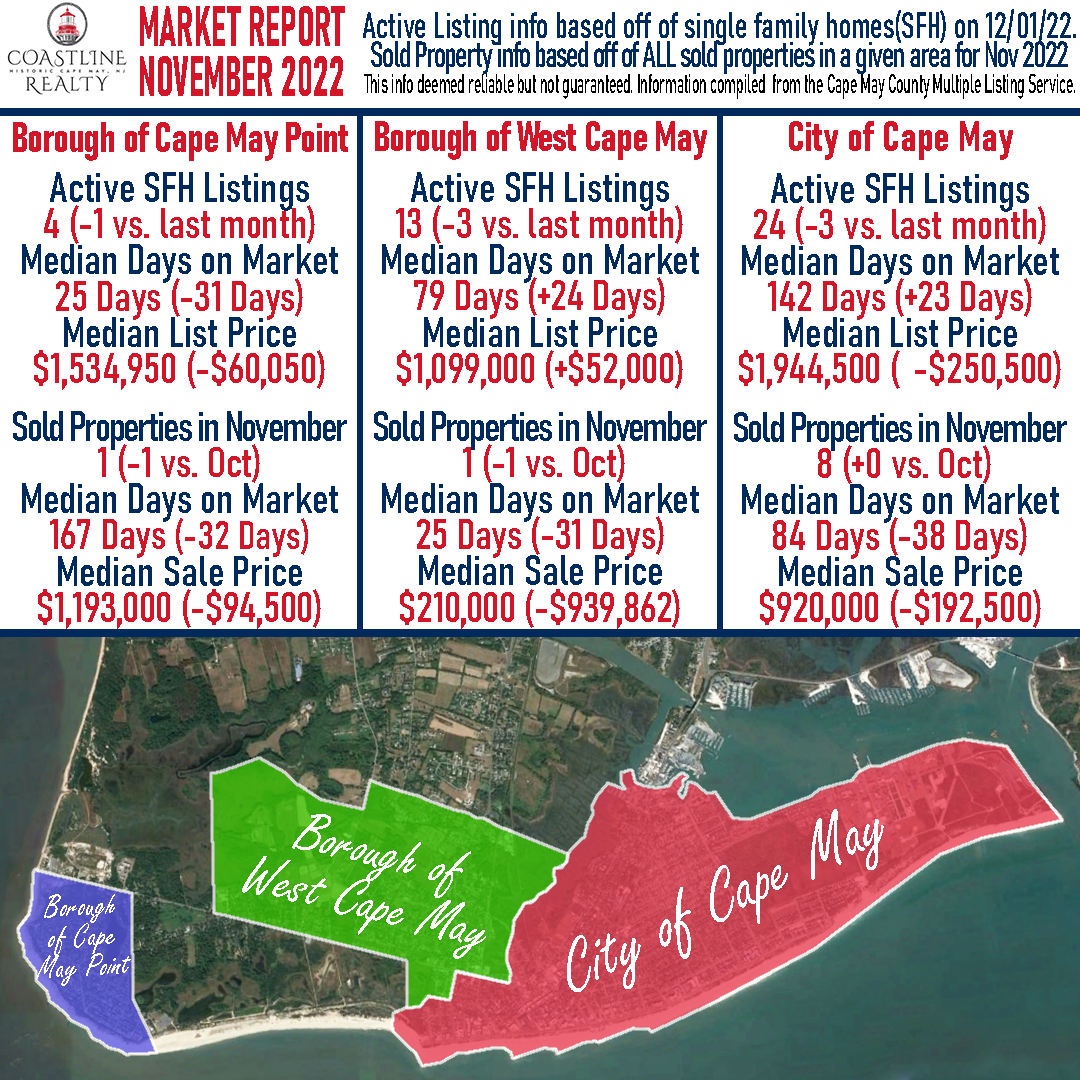
To start the month of December, Cape May, West Cape May, and Cape May Point all saw fewer active listings on the market. All three areas continue the trend of the median asking prices being above $1,000,000, with Cape May the highest at $1,944,500. Sold properties during November fell slightly by 2 properties, and the median sale prices dropped as well. West Cape May’s median sale price dropped dramatically based on only 1 property sold during the month, and it was a mobile home.
Cape May Area (including Cape May City – West Cape May – Cape May Point)
Active SFH Listings as of 12/01/22– 41 (-7 vs. last month)
Median Days on Market – 91 Days (-24 Days vs. last month)
Median List Price – $1,570,000 (-$27,500 vs. last month)
Sold Properties in November – 10 (-2 vs. last month)
Median Days on Market – 84 Days (-38 days vs. last month)
Median Sale Price – $920,000 (-$205,000 vs. last month)
Cape May
Active SFH Listings as of 12/01/22– 24 (-3 vs. last month)
Median Days on Market – 142 Days (+23 days vs. last month)
Median List Price – $1,944,500 (-$250,500 vs. last month)
Sold Properties in November – 8 (+0 vs. last month)
Median Days on Market – 84 Days (-38 days vs. last month)
Median Sale Price – $920,000 (-$192,500 vs. last month)
West Cape May
Active SFH Listings as of 12/01/22– 13 (-3 vs. last month)
Median Days on Market – 79 Days (+24 days vs. last month)
Median List Price – $1,099,000 (+$52,000 vs. last month)
Sold Properties in November – 1 (-1 vs. last month)
Median Days on Market – 25 Days (-31 days vs. last month)
Median Sale Price – $210,000 (-$939,862 vs. last month)
Cape May Point
Active SFH Listings as of 12/01/22– 4 (-1 vs. last month)
Median Days on Market – 129 Days (+83 Days vs. last month)
Median List Price – $1,534,950 (-$60,050 vs. last month)
Sold Properties in November – 1 (-1 vs. last month)
Median Days on Market – 167 (-32 Days vs. last month)
Median Sale Price – $1,193,000 (-$94,500 vs. last month)
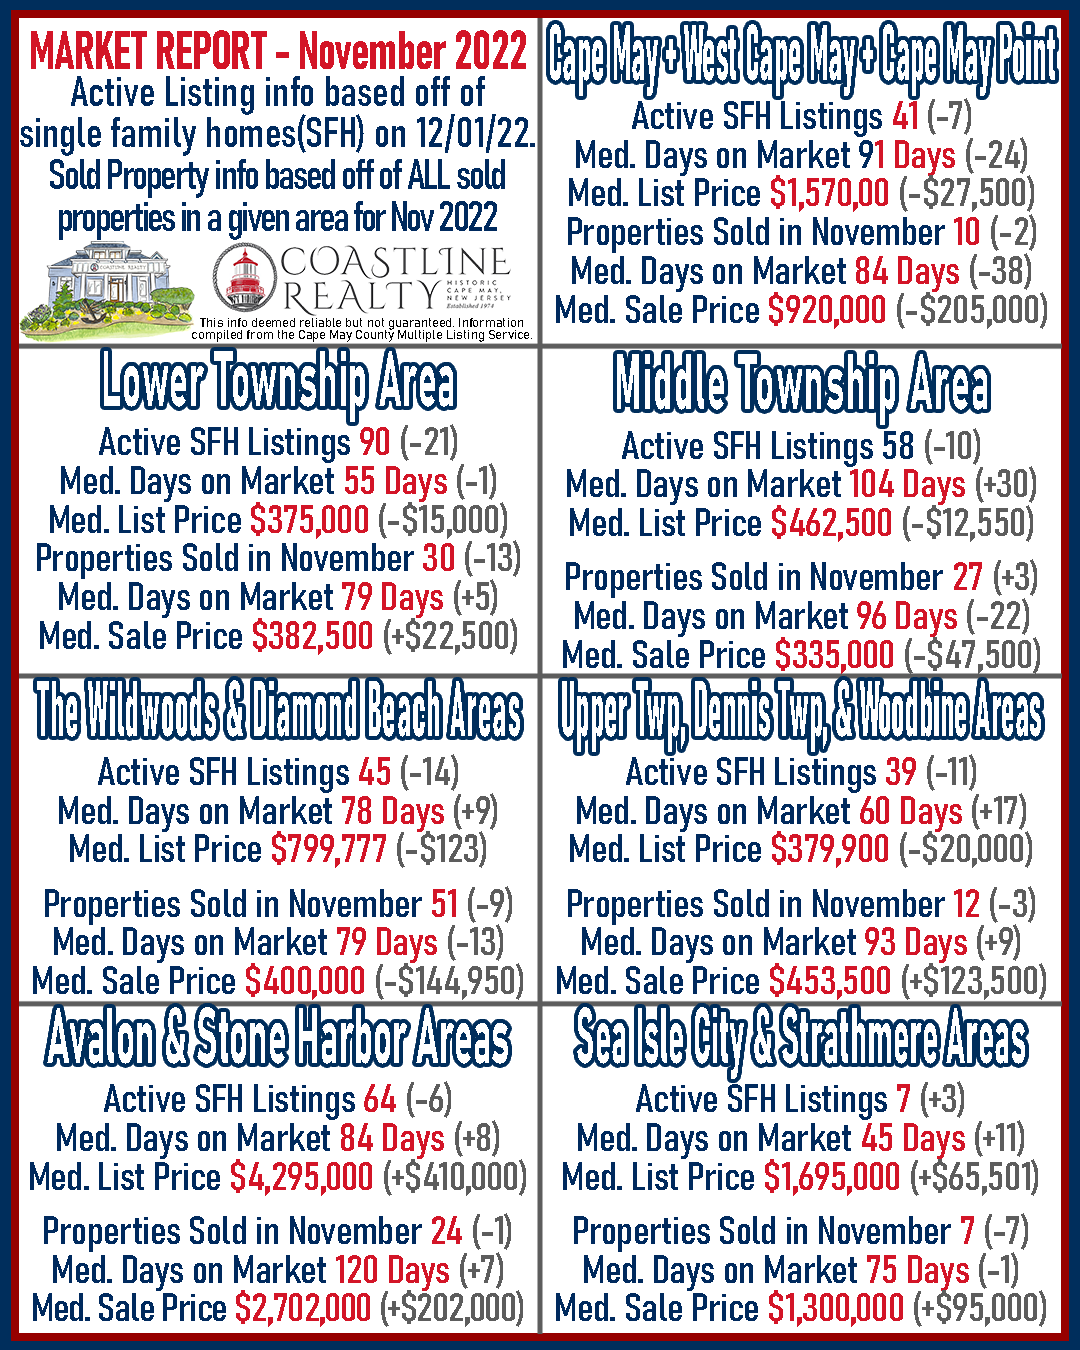
Across Cape May County, to start the month of December, the trend was fewer active listings on the market than in November. Median list prices trended lower in most areas in the county besides Avalon, Stone Harbor, and Sea Isle City.
In November, properties sold fell almost in every area tracked in Cape May County besides Middle Township, which saw 27 properties sell during the month, 3 more than in October. Median Sale prices did not see any clearly defined trend as the county was split between areas with an increase or decrease in sale price.
Lower Township
Active SFH Listings as of 12/01/22– 90 (-21 vs. last month)
Median Days on Market – 55 Days (-1 days vs. last month)
Median List Price – $375,000 (-$15,000 vs. last month)
Sold Properties in November – 30 (-13 vs. last month)
Median Days on Market – 79 Days (+5 days vs. last month)
Median Sale Price – $382,500 (+$22,500 vs. last month)
Middle Township
Active SFH Listings as of 12/01/22– 58 (-10 vs. last month)
Median Days on Market – 104 Days (+30 days vs. last month)
Median List Price – $462,500 (-$12,550 vs last month)
Sold Properties in November – 27 (+3 vs. last month)
Median Days on Market – 96 Days (-22 days vs. last month)
Median Sale Price – $335,000 (-$47,500 vs. last month)
The Wildwoods & Diamond Beach
Active SFH Listings as of 12/01/22– 45 (-14 vs. last month)
Median Days on Market – 78 Days (+9 Days vs. last month)
Median List Price – $799,777 (-$123 vs. last month)
Sold Properties in November – 51 (-9 vs. last month)
Median Days on Market – 70 Days (-13 days vs. last month)
Median Sale Price – $400,000 (-$144,950 vs. last month)
Dennis Township – Upper Township – Woodbine
Active SFH Listings as of 12/01/22– 38 (-11 vs. last month)
Median Days on Market –60 Days (+17 days vs. last month)
Median List Price – $379,900 (-$20,000 vs. last month)
Sold Properties in November – 12 (-3 vs. last month)
Median Days on Market – 93 Days (+9 days vs. last month)
Median Sale Price – $453,500 (+$123,500 vs. last month)
Avalon & Stone Harbor
Active SFH Listings as of 12/01/22– 64 (-6 vs. last month)
Median Days on Market – 84 Days (+8 days vs. last month)
Median List Price – $4,295,000 (+$410,000 vs. last month)
Sold Properties in November – 24 (-1 vs. last month)
Median Days on Market – 120 Days (+7 days vs. last month)
Median Sale Price – $2,702,000 (+$202,000 vs. last month)
Sea Isle City & Strathmere
Active SFH Listings as of 12/01/22– 7 (+3 vs. last month)
Median Days on Market – 45 Days (+11 days vs. last month)
Median List Price – $1,695,000 (+$65,501 vs. last month)
Sold Properties in November – 7 (-7 vs. last month)
Median Days on Market – 76 Days (-1 days vs. last month)
Median Sale Price – $1,300,000 (+$95,000 vs. last month)
Are you looking to sell your property. Or are you curious about what it’s market value is? Give us a call at 609-884-5005 or inquire on our website. https://www.coastlinerealty.com/real-estate/selling-your-property
This info deemed reliable but not guaranteed. Information compiled from the Cape May County Multiple Listing Service.