Market Report! Here’s a quick Real Estate market report of most of Cape May County. Included is a recap of all sold properties(SFH, Land, Condo, etc) in the month of October 2022 for a given area; as well as a current look at the current inventory of residential single family homes(SFH) in an area as of November 4th, 2022
During the month of October in Cape May, West Cape May, and Cape May Point the areas saw the number of properties sold drop by 10 down from 22 to 12. Most of this was in the City of Cape May which saw 9 fewer properties sell compared to the previous month. Despite the fewer number of homes closing during the month, the median sale price rose $163,000 up to $1,125,000.
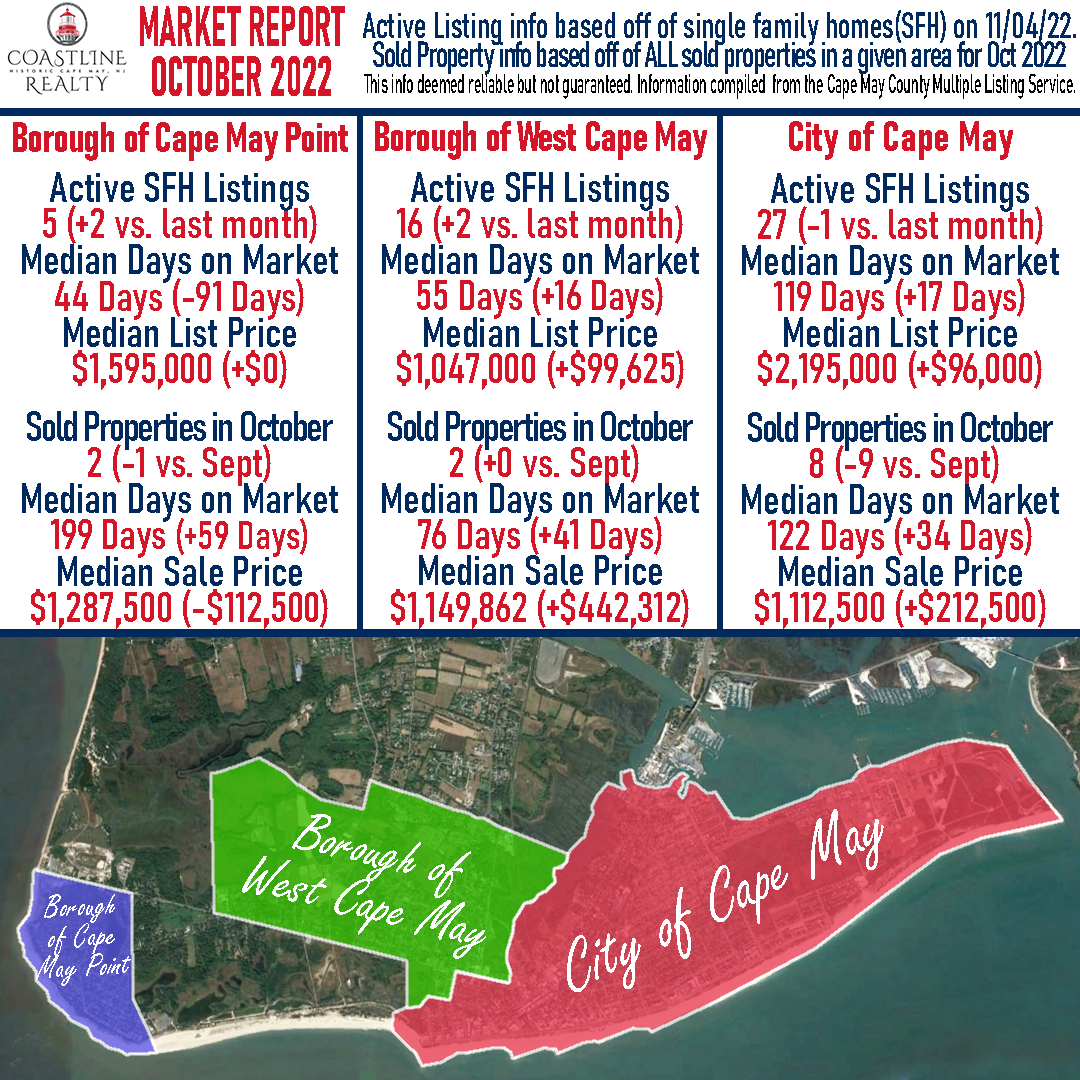
To begin November the combined Cape May area saw a small rise in the number of properties on the market and the median list price. Days on Market climbed 21 days up to 115 Days which is the trend across the county. Cape May Point has the lowest Days on Market with a median value of 44 and the City of Cape May the highest at 119 Days as of November 4th.
Cape May Area (including Cape May City – West Cape May – Cape May Point)
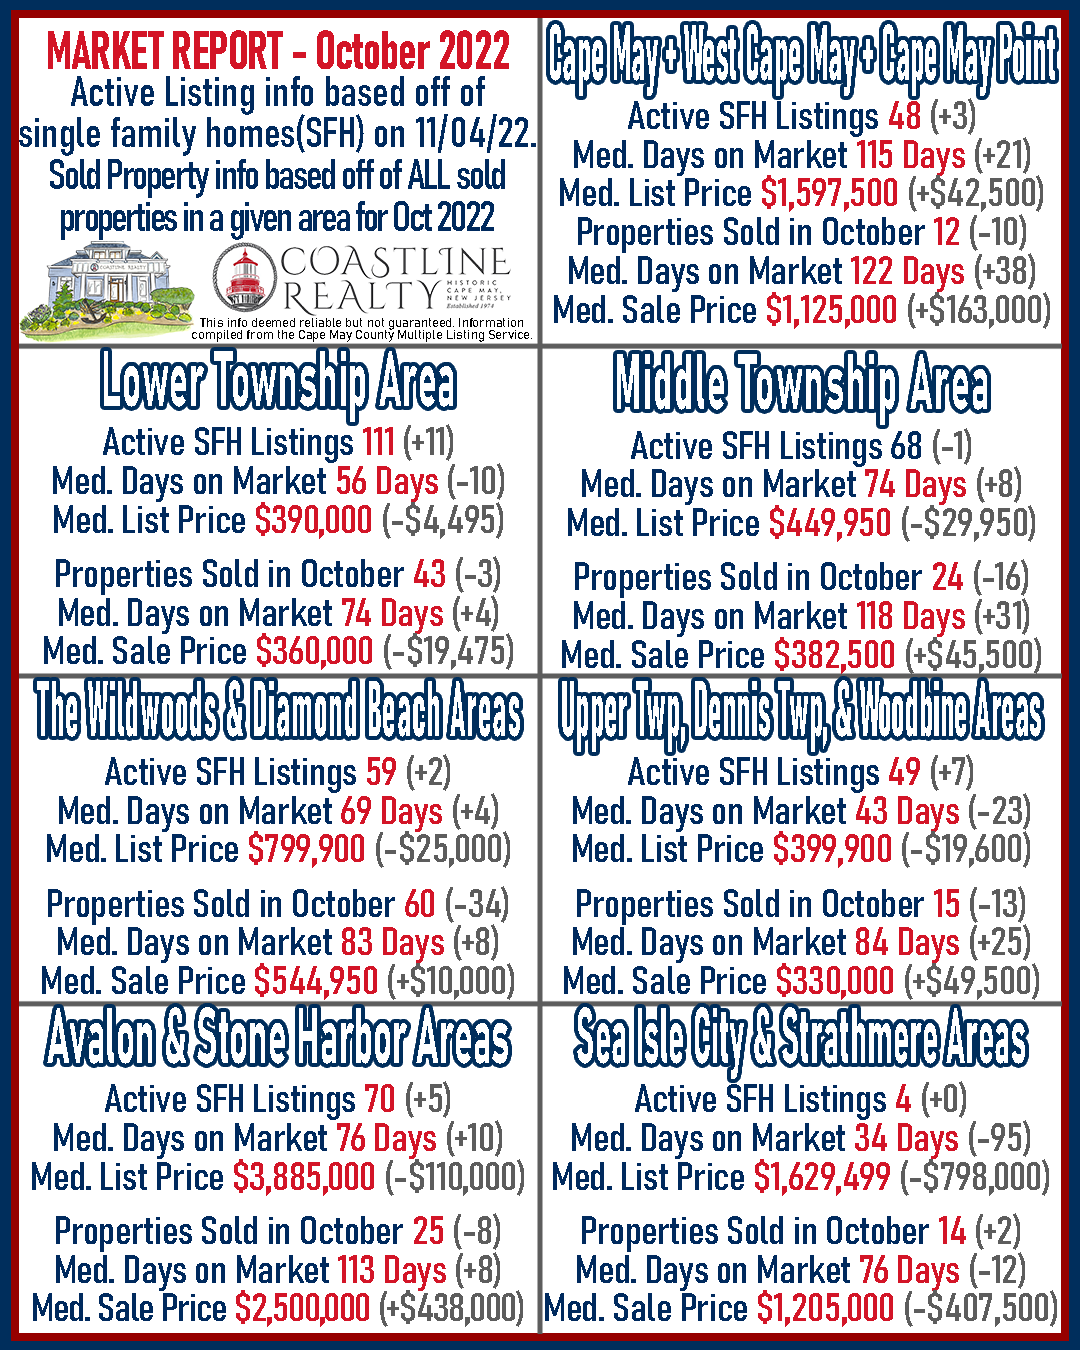
Active SFH Listings as of 11/04/22– 48 (+3 vs. last month)
Median Days on Market – 115 Days (+21 Days vs. last month)
Median List Price – $1,597,500 (+$42,500 vs. last month)
Sold Properties in October – 12 (-10 vs. last month)
Median Days on Market – 122 Days (+38 days vs. last month)
Median Sale Price – $1,125,000 (+$163,000 vs. last month)
Cape May
Active SFH Listings as of 11/04/22– 27 (-1 vs. last month)
Median Days on Market – 119 Days (+17 days vs. last month)
Median List Price – $2,195,000 (+$96,000 vs. last month)
Sold Properties in October – 8 (-9 vs. last month)
Median Days on Market – 122 Days (+34 days vs. last month)
Median Sale Price – $1,112,500 (+$212,500 vs. last month)
West Cape May
Active SFH Listings as of 11/04/22– 16 (+2 vs. last month)
Median Days on Market – 55 Days (+16 days vs. last month)
Median List Price – $1,047,000 (+$99,625 vs. last month)
Sold Properties in October – 2 (+0 vs. last month)
Median Days on Market – 76 Days (+41 days vs. last month)
Median Sale Price – $1,149,862 (+$442,312 vs. last month)
Cape May Point
Active SFH Listings as of 11/04/22– 5 (+2 vs. last month)
Median Days on Market – 44 Days (-91 Days vs. last month)
Median List Price – $1,595,000 (+$0 vs. last month)
Sold Properties in October – 2 (-1 vs. last month)
Median Days on Market – 199 (+59 Days vs. last month)
Median Sale Price – $1,287,500 (-$112,500 vs. last month)
Across the Cape May County the trend for properties that sold in October was mostly that of fewer properties selling and the median days on market to do so being longer than in September. Most notably The Wildwoods saw a dramatic drop in closings with 34 fewer compared to a month before, and the only area to see an increase was in the Sea Isle City and Strathmere area.
To begin November most areas saw an uptick in the number of active listings compared to a month prior and those that did not hardly changed at all. The median days on market continues to trend lower than it historically has been with many areas under 80 days. The highest in Cape May County is the combined Cape May / West Cape May / Cape May Point areas at 115 days. Asking prices when accounting for size/location/type of properties trended downward in most areas in the county to begin November despite some areas seeing median listing prices rise for the month-to-month change.
Lower Township
Active SFH Listings as of 11/04/22– 111 (+11 vs. last month)
Median Days on Market – 56 Days (-10 days vs. last month)
Median List Price – $390,000 (-$4,495 vs. last month)
Sold Properties in October – 43 (-3 vs. last month)
Median Days on Market – 74 Days (+4 days vs. last month)
Median Sale Price – $360,000 (-$19,475 vs. last month)
Middle Township
Active SFH Listings as of 11/04/22– 68 (-1 vs. last month)
Median Days on Market – 74 Days (+8 days vs. last month)
Median List Price – $449,950 (-$29,950 vs last month)
Sold Properties in October – 24 (-16 vs. last month)
Median Days on Market – 118 Days (+31 days vs. last month)
Median Sale Price – $382,500 (+$45,500 vs. last month)
The Wildwoods & Diamond Beach
Active SFH Listings as of 11/04/22– 59 (+2 vs. last month)
Median Days on Market – 69 Days (+4 Days vs. last month)
Median List Price – $799,900 (-$25,000 vs. last month)
Sold Properties in October – 60 (-34 vs. last month)
Median Days on Market – 83 Days (+8 days vs. last month)
Median Sale Price – $544,950 (+$10,000 vs. last month)
Dennis Township – Upper Township – Woodbine
Active SFH Listings as of 11/04/22– 49 (+7 vs. last month)
Median Days on Market – 43 Days (-23 days vs. last month)
Median List Price – $399,900 (-$19,600 vs. last month)
Sold Properties in October – 15 (-13 vs. last month)
Median Days on Market – 84 Days (+25 days vs. last month)
Median Sale Price – $330,000 (+$49,500 vs. last month)
Avalon & Stone Harbor
Active SFH Listings as of 11/04/22– 70 (+5 vs. last month)
Median Days on Market – 76 Days (+10 days vs. last month)
Median List Price – $3,885,000 (-$110,000 vs. last month)
Sold Properties in October – 25 (-8 vs. last month)
Median Days on Market – 113 Days (+8 days vs. last month)
Median Sale Price – $2,500,000 (+$438,000 vs. last month)
Sea Isle City & Strathmere
Active SFH Listings as of 11/04/22– 4 (+0 vs. last month)
Median Days on Market – 34 Days (-95 days vs. last month)
Median List Price – $1,629,499 (-$798,000 vs. last month)
Sold Properties in October – 14 (+2 vs. last month)
Median Days on Market – 76 Days (-12 days vs. last month)
Median Sale Price – $1,205,000 (-$407,500 vs. last month)
Are you looking to sell your property. Or are you curious about what it’s market value is? Give us a call at 609-884-5005 or inquire on our website. https://www.coastlinerealty.com/real-estate/selling-your-property
This info deemed reliable but not guaranteed. Information compiled from the Cape May County Multiple Listing Service.