Market Report! Here’s a quick Real Estate market report of most of Cape May County. Included is a recap of all sold properties(SFH, Land, Condo, etc) in the month of September 2022 for a given area; as well as a current look at the current inventory of residential single family homes(SFH) in an area as of October 10th, 2022
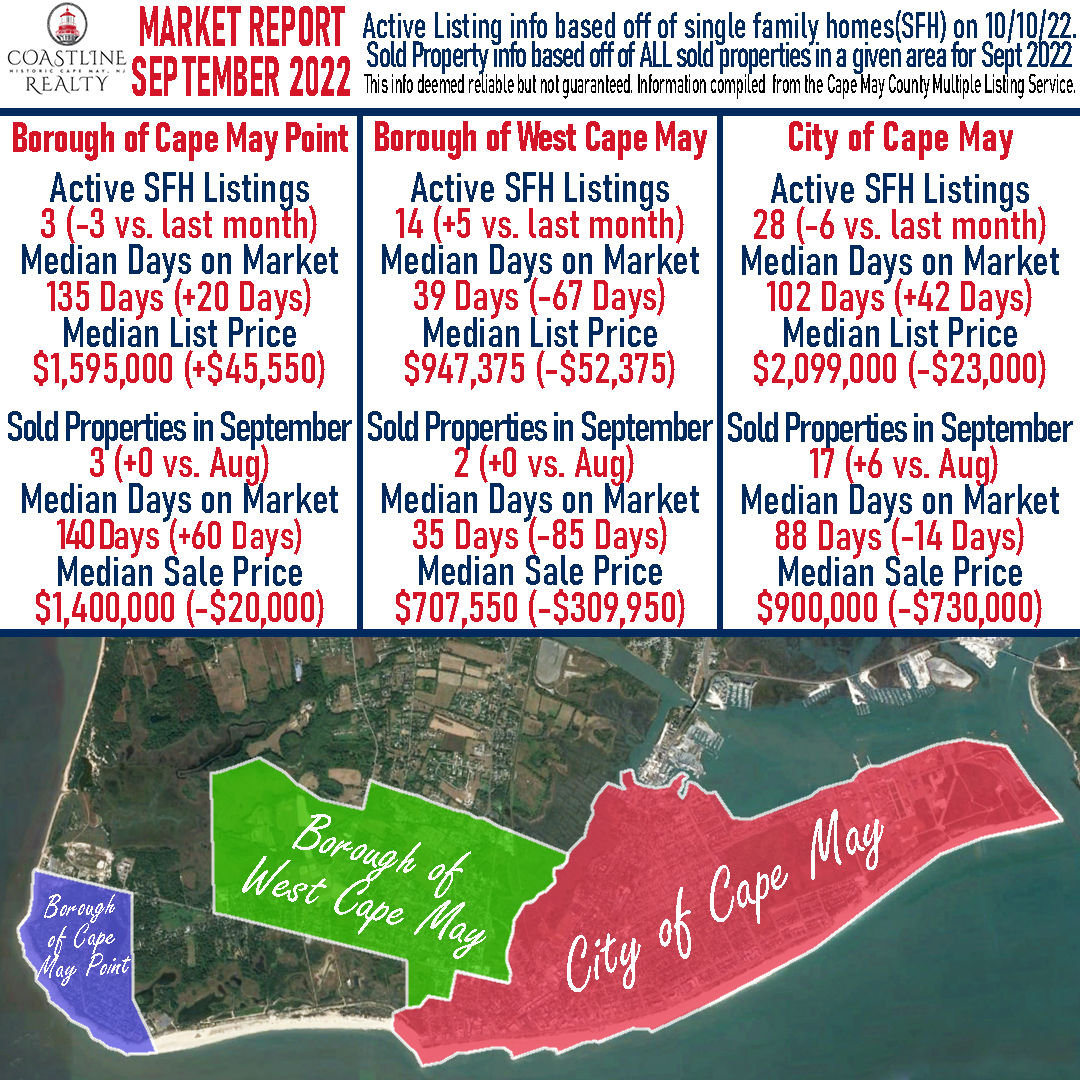
September in the Cape May area saw the City of Cape May increase the number of properties that sold during the month while West Cape May and Cape May Point saw no change month-over-month.
The median sale price did fall across all three areas, especially in Cape May that saw a $730,000 decline that was partially influenced by roughly half of the properties that sold during the month being small condo units and quad/duplex properties. To start off October inventory remains low in both the City of Cape May and Cape May Point. West Cape May saw a rise in active listings on the market to begin October.
Cape May
Active SFH Listings as of 10/10/22– 28 (-6 vs. last month)
Median Days on Market – 102 Days (+42 days vs. last month)
Median List Price – $2,099,000 (-$23,000 vs. last month)
Sold Properties in September– 17 (+6 vs. last month)
Median Days on Market – 88 Days (-14 days vs. last month)
Median Sale Price – $900,000 (-$730,000 vs. last month)
West Cape May
Active SFH Listings as of 10/10/22– 14 (+5 vs. last month)
Median Days on Market – 39 Days (-67 days vs. last month)
Median List Price – $947,375 (-$52,375 vs. last month)
Sold Properties in September – 2 (+0 vs. last month)
Median Days on Market – 35 Days (-85 days vs. last month)
Median Sale Price – $707,550 (-$309,950 vs. last month)
Cape May Point
Active SFH Listings as of 10/10/22– 3 (-3 vs. last month)
Median Days on Market – 135 Days (+20 Days vs. last month)
Median List Price – $1,595,000 (+$45,550 vs. last month)
Sold Properties in September – 3 (+0 vs. last month)
Median Days on Market – 140 (+60 Days vs. last month)
Median Sale Price – $1,400,000 (-$20,000 vs. last month)
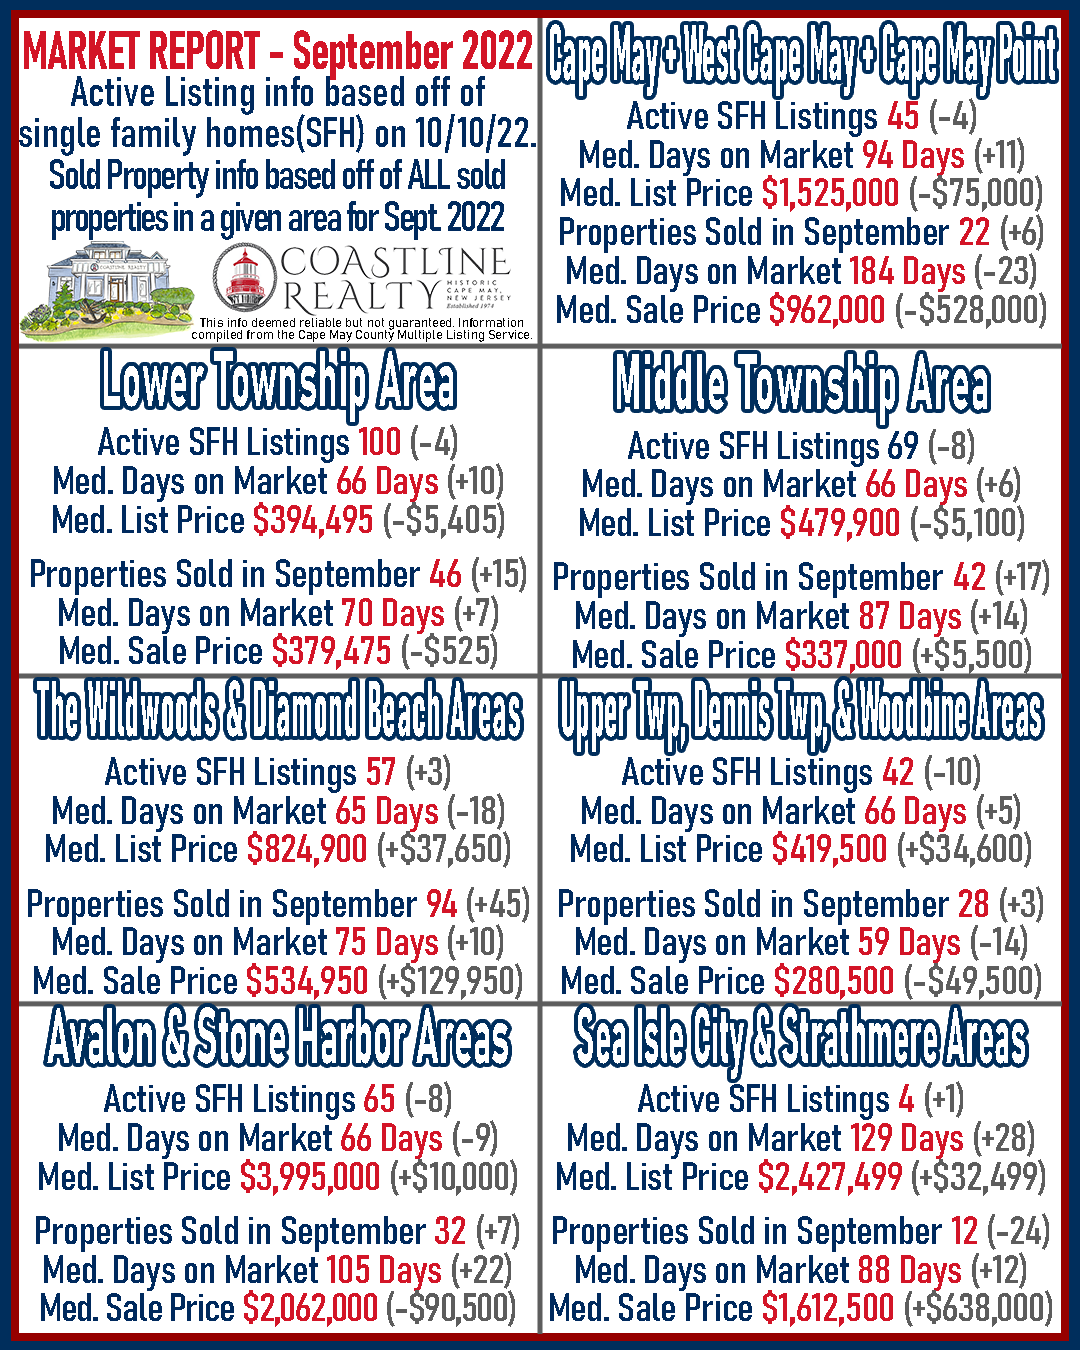
The trend across most of Cape May County to begin October is lower active inventory on the market as most areas are seeing the number of active properties drop going into the Fall. The median days on market is rising as well for most of the County while median list price trends slightly downwards besides the Wildwoods and Sea Isle City markets.
During September every area in Cape May County shown in this chart saw a rise in sold properties during the month aside from Sea Isle City/Strathmere. Most notably was the Wildwoods that saw a massive +45 increase compared to the previous month, most likely due to properties waiting until the summer season ended for closing to happen. Median sale prices had no trend across the County as some areas saw increases while others decreases largely due to the type of properties that sold during the month.
Cape May Area (includes Cape May City – West Cape May – Cape May Point)
Active SFH Listings as of 10/10/22– 45 (-4 vs. last month)
Median Days on Market – 94 Days (+11 Days vs. last month)
Median List Price – $1,525,000 (-$75,000 vs. last month)
Sold Properties in September – 22 (+6 vs. last month)
Median Days on Market – 84 Days (-23 days vs. last month)
Median Sale Price – $962,000 (-$528,000 vs. last month)
Lower Township
Active SFH Listings as of 10/10/22– 100 (-4 vs. last month)
Median Days on Market – 66 Days (+10 days vs. last month)
Median List Price – $394,495 (-$5,405 vs. last month)
Sold Properties in September – 46 (+15 vs. last month)
Median Days on Market – 70 Days (+7 days vs. last month)
Median Sale Price – $379,475 (-$525 vs. last month)
Middle Township
Active SFH Listings as of 10/10/22– 69 (-8 vs. last month)
Median Days on Market – 66 Days (+6 days vs. last month)
Median List Price – $479,900 (-$5,100 vs last month)
Sold Properties in September – 42 (+17 vs. last month)
Median Days on Market – 87 Days (+14 days vs. last month)
Median Sale Price – $337,000 (+$5,500 vs. last month)
The Wildwoods & Diamond Beach
Active SFH Listings as of 10/10/22– 57 (+3 vs. last month)
Median Days on Market – 65 Days (-18 Days vs. last month)
Median List Price – $824,900 (+$37,650 vs. last month)
Sold Properties in September – 94 (+45 vs. last month)
Median Days on Market – 75 Days (+10 days vs. last month)
Median Sale Price – $534,950 (+$129,950 vs. last month)
Dennis Township – Upper Township – Woodbine
Active SFH Listings as of 10/10/22– 42 (-10 vs. last month)
Median Days on Market – 66 Days (+5 days vs. last month)
Median List Price – $419,500 (+$34,600 vs. last month)
Sold Properties in September – 28 (+3 vs. last month)
Median Days on Market – 59 Days (-14 days vs. last month)
Median Sale Price – $280,500 (-$49,500 vs. last month)
Avalon & Stone Harbor
Active SFH Listings as of 10/10/22– 65 (-8 vs. last month)
Median Days on Market – 66 Days (-9 days vs. last month)
Median List Price – $3,995,000 (+$10,000 vs. last month)
Sold Properties in September – 32 (+7 vs. last month)
Median Days on Market – 105 Days (+22 days vs. last month)
Median Sale Price – $2,062,000 (-$90,500 vs. last month)
Sea Isle City & Strathmere
Active SFH Listings as of 10/10/22– 4 (+1 vs. last month)
Median Days on Market – 129 Days (+28 days vs. last month)
Median List Price – $2,427,499 (+$32,499 vs. last month)
Sold Properties in September – 12 (-2 vs. last month)
Median Days on Market – 88 Days (+12 days vs. last month)
Median Sale Price – $1,612,500 (+$638,000 vs. last month)
Are you looking to sell your property. Or are you curious about what it’s market value is? Give us a call at 609-884-5005 or inquire on our website. https://www.coastlinerealty.com/real-estate/selling-your-property
This info deemed reliable but not guaranteed. Information compiled from the Cape May County Multiple Listing Service.