Real Estate Market Report - Cape May County - August 2022
Market Report! Here s a quick Real Estate market report of most of Cape May County. Included is a recap of all sold properties(SFH, Land, Condo, etc) in the month of July 2022 for a given area; as well as a current look at the current inventory of residential single family homes(SFH) in an area as of September 6th, 2022
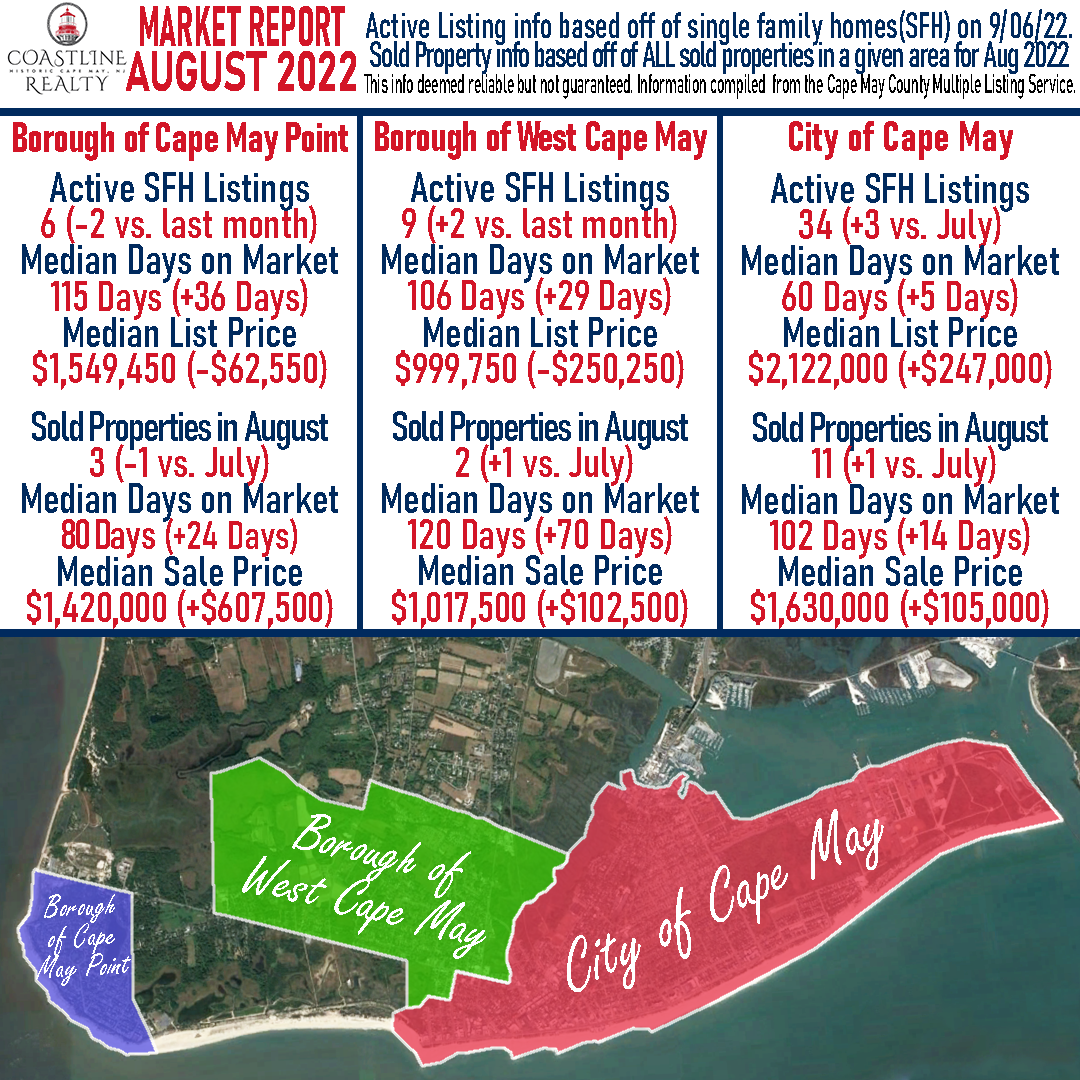
In the month of August, the City of Cape May saw a notable rise in median list price in the amount of $247,000 compared to the previous month. West Cape May & Cape May Point both saw the median list price drop for the month compared to the previous month.
Days on Market for active properties to start off September rose significantly besides the City of Cape May that only saw a modest 5 day increase. For all three areas the median sale price rose noticeably, especially in Cape May Point that saw a $607,500 increase compared to July.
Cape May
Active SFH Listings as of 9/06/22 34 (+3 vs. last month)
Median Days on Market 60 Days (+5 days vs. last month)
Median List Price - $2,122,000 (+$247,000 vs. last month)
Sold Properties in August 11 (+1 vs. last month)
Median Days on Market 102 Days (+14 days vs. last month)
Median Sale Price - $1,630,000 (+$105,000 vs. last month)
West Cape May
Active SFH Listings as of 9/06/22 9 (+2 vs. last month)
Median Days on Market 106 Days (+29 days vs. last month)
Median List Price - $999,750 (-$250,250 vs. last month)
Sold Properties in August 2 (+1 vs. last month)
Median Days on Market 120 Days (+70 days vs. last month)
Median Sale Price - $1,017,500 (+$102,500 vs. last month)
Cape May Point
Active SFH Listings as of 9/06/22 6 (-2 vs. last month)
Median Days on Market 115 Days (+36 Days vs. last month)
Median List Price - $1,549,450 (-$62,550 vs. last month)
Sold Properties in August 3 (-1 vs. last month)
Median Days on Market 80 (+24 Days vs. last month)
Median Sale Price $1,420,000 (+$607,500 vs. last month)
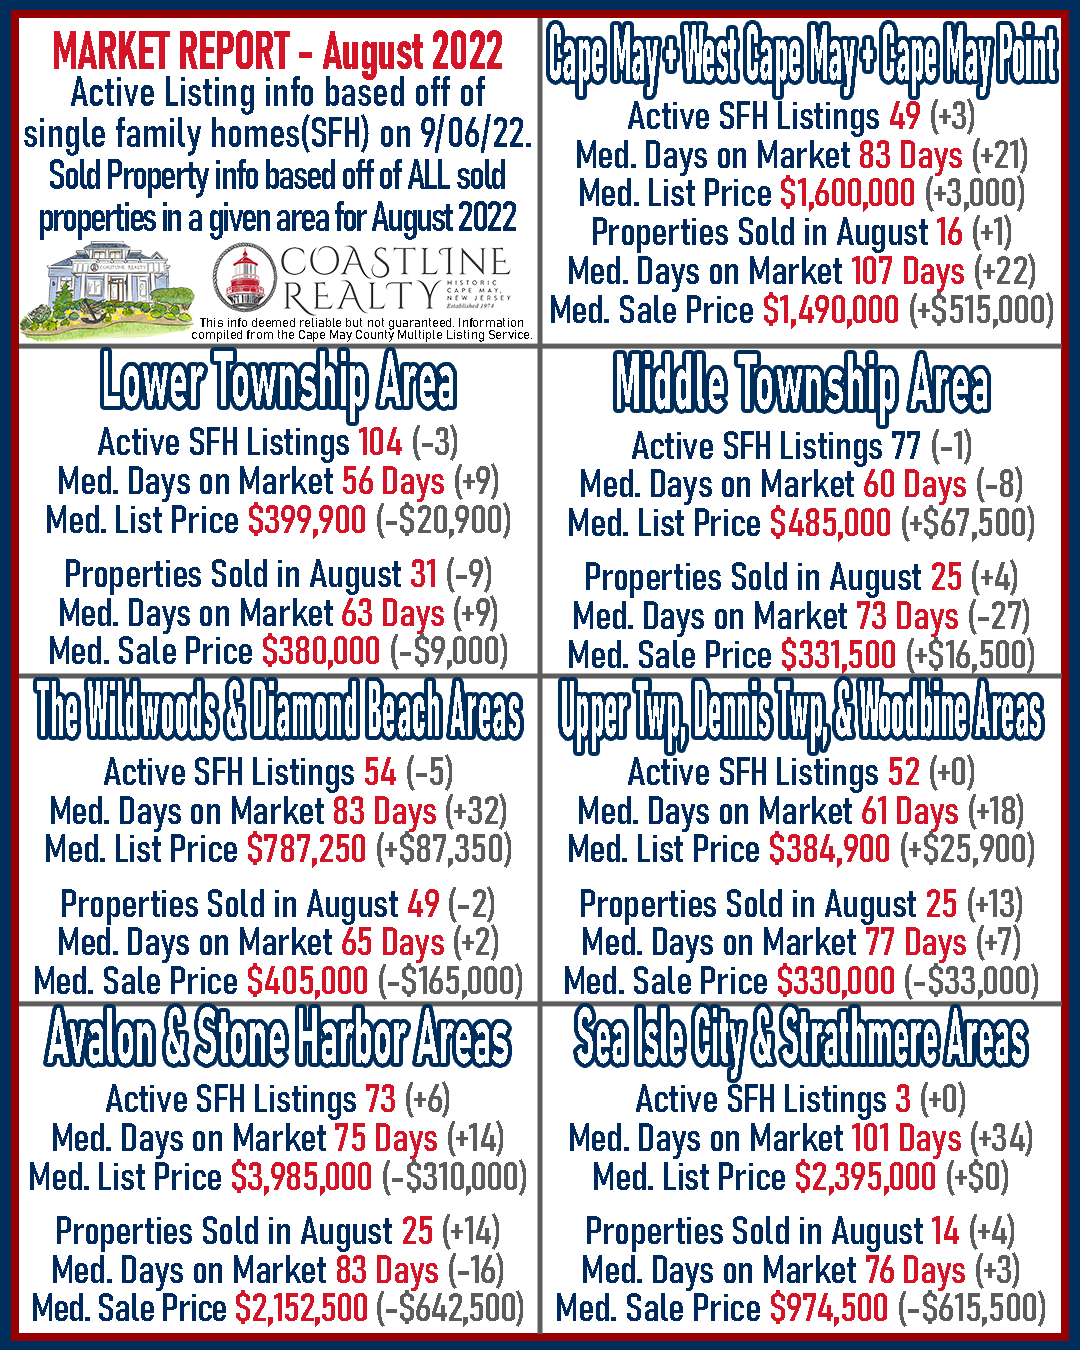
Across Cape May County to begin September there wasn't a huge shift in active listings compared to July. Most areas saw a rise in median days on market, but otherwise sale prices and the number of active listings remained steady.
Properties that sold in August for most of of the county aside from the Cape May Area and Middle Township saw drops in the median sale prices month-over-month. The number of properties increased in most areas in the county as well aside from Lower Township and the Wildwoods/Diamond Beach.
Cape May Area (including Cape May City West Cape May Cape May Point)
Active SFH Listings as of 9/06/22 49 (+3 vs. last month)
Median Days on Market 83 Days (+21 Days vs. last month)
Median List Price - $1,600,000 (+$3,000 vs. last month)
Sold Properties in August 16 (+1 vs. last month)
Median Days on Market 107 Days (+22 days vs. last month)
Median Sale Price - $1,490,000 (+$515,000 vs. last month)
Lower Township
Active SFH Listings as of 9/06/22 104 (-3 vs. last month)
Median Days on Market 56 Days (+9 days vs. last month)
Median List Price - $399,900 (-$20,900 vs. last month)
Sold Properties in August 31 (-9 vs. last month)
Median Days on Market 63 Days (+9 days vs. last month)
Median Sale Price - $380,000 (-$9,000 vs. last month)
Middle Township
Active SFH Listings as of 9/06/22 77 (-1 vs. last month)
Median Days on Market 60 Days (-8 days vs. last month)
Median List Price - $485,000 (+$67,500 vs last month)
Sold Properties in August 25 (+4 vs. last month)
Median Days on Market 73 Days (-27 days vs. last month)
Median Sale Price - $331,500 (+$16,500 vs. last month)
The Wildwoods & Diamond Beach
Active SFH Listings as of 9/06/22 54 (-5 vs. last month)
Median Days on Market 83 Days (+32 Days vs. last month)
Median List Price - $787,250 (+$87,350 vs. last month)
Sold Properties in August 49 (-2 vs. last month)
Median Days on Market 65 Days (+2 days vs. last month)
Median Sale Price - $405,000 (-$165,000 vs. last month)
Dennis Township Upper Township - Woodbine
Active SFH Listings as of 9/06/22 52 (+0 vs. last month)
Median Days on Market 61 Days (+18 days vs. last month)
Median List Price - $384,900 (+$25,900 vs. last month)
Sold Properties in August 25 (+13 vs. last month)
Median Days on Market 77 Days (+7 days vs. last month)
Median Sale Price - $330,000 (-$33,000 vs. last month)
Avalon & Stone Harbor
Active SFH Listings as of 9/06/22 73 (+6 vs. last month)
Median Days on Market 75 Days (+14 days vs. last month)
Median List Price - $3,985,000 (-$310,000 vs. last month)
Sold Properties in August 25 (+14 vs. last month)
Median Days on Market 83 Days (-16 days vs. last month)
Median Sale Price - $2,152,500 (-$642,500 vs. last month)
Sea Isle City & Strathmere
Active SFH Listings as of 9/06/22 3 (+0 vs. last month)
Median Days on Market 101 Days (+34 days vs. last month)
Median List Price - $2,395,000 (+0 vs. last month)
Sold Properties in August 14 (+4 vs. last month)
Median Days on Market 76 Days (+3 days vs. last month)
Median Sale Price - $974,500 (-$615,500 vs. last month)